• This is a political forum that is non-biased/non-partisan and treats every person's position on topics equally. This debate forum is not aligned to any political party. In today's politics, many ideas are split between and even within all the political parties. Often we find ourselves agreeing on one platform but some topics break our mold. We are here to discuss them in a civil political debate. If this is your first visit to our political forums, be sure to check out the RULES. Registering for debate politics is necessary before posting. Register today to participate - it's free!

Misleading AGW statements by media.

longview

DP Veteran
Joined
Jan 25, 2012
Messages
44,615
Reaction score
14,470
Location
Texas
Gender
Male
Political Leaning
Conservative
Today's Yahoo page has an article titled,
https://www.yahoo.com/news/m/cb212fc4-097d-395c-af85-821d153aa4f3/a-warming-world:-july-marks.html
A warming world: July marks 'hottest month on record'
and
What makes this record particularly noteworthy is that this was the warmest month - of any month - since records began in 1880,
So what is wrong with the statement?
Well in the GISS record cited July 2016, is no where near the warmest month ever recorded, or even this year.
http://data.giss.nasa.gov/gistemp/tabledata_v3/GLB.Ts+dSST.txt
It was within the GISS the highest July ever by .1 C, but .48 C lower than February of this year.
2015 82 87 91 74 79 79 73 79 82 107 102 110 87 84 83 81 77 97 2015
2016 116 132 128 108 94 79 84 **** **** **** **** **** *** 120 110 **** **** 2016
Year Jan Feb Mar Apr May Jun Jul Aug Sep Oct Nov Dec J-D D-N DJF MAM JJA SON Year
 
[h=2]CO2 causes cold-hot East-West split climate change in the USA![/h]
Somewhere in the world, a whole town is missing their tea-leaf readers.
The Physics tells us (practical beats us over the head) that more CO2 will mean warmer nights. It is a 97% certified mantra that warm nights are a fingerprint of man-made global warming.*
Well don’t look now, but CO2 causes cold nights too (and get this… on the East Coast).
[h=3]Extreme-weather winters are becoming more common in US[/h]Recent years have seen a dramatic increase in the simultaneous occurrence of extremely cold winter days in the Eastern United States and extremely warm winter days in the West, according to a Stanford-led study published in Journal of Geophysical Research Atmospheres. Human-caused emissions of greenhouse gases are likely driving this trend, the researchers report.
Used to be that single seasons were “weather” and thirty year trends were “science”– now all they need is a single repeated season and half a country:
“Looking back at temperature data from the past 35 years, we’ve found that in fact 2013-2014 and 2014-2015 did have the biggest difference in winter temperature between the East and West.”
This is pretty freaky — can you imagine how smart these guys must be to spot this pattern? We are talking GCM-Rorschach. Coming soon — record differences from 6 – 9am in Spring mornings in States starting with P.
After that, alternating hot-cold weather split north-south, oh wait…
 
Today's Yahoo page has an article titled,
https://www.yahoo.com/news/m/cb212fc4-097d-395c-af85-821d153aa4f3/a-warming-world:-july-marks.html

and

So what is wrong with the statement?
Well in the GISS record cited July 2016, is no where near the warmest month ever recorded, or even this year.
http://data.giss.nasa.gov/gistemp/tabledata_v3/GLB.Ts+dSST.txt
It was within the GISS the highest July ever by .1 C, but .48 C lower than February of this year.

You just knew this was going to happen. They can't help themselves. It's pitiful.
 
Today's Yahoo page has an article titled,
https://www.yahoo.com/news/m/cb212fc4-097d-395c-af85-821d153aa4f3/a-warming-world:-july-marks.html

and

So what is wrong with the statement?
Well in the GISS record cited July 2016, is no where near the warmest month ever recorded, or even this year.
http://data.giss.nasa.gov/gistemp/tabledata_v3/GLB.Ts+dSST.txt
It was within the GISS the highest July ever by .1 C, but .48 C lower than February of this year.

So why do you think the people at NASA made that statement?

Do you think they don't understand their own data as well as you do?

Data.GISS: GISTEMP Update: NASA Analysis Finds July 2016 is Warmest on Record

Seriously...I mean WTF is wrong with you people?
 
So why do you think the people at NASA made that statement?

Do you think they don't understand their own data as well as you do?

Data.GISS: GISTEMP Update: NASA Analysis Finds July 2016 is Warmest on Record

Seriously...I mean WTF is wrong with you people?
We have been over this, the anomaly numbers for a month have little meaning unless the monthly baselines are published.
GISS is free to say whatever they want, but unless they provide the necessary baselines, their statement cannot be verified.
NOAA publishes baselines, shouldn't the GISS?
 
Today's Yahoo page has an article titled,
https://www.yahoo.com/news/m/cb212fc4-097d-395c-af85-821d153aa4f3/a-warming-world:-july-marks.html

and

So what is wrong with the statement?
Well in the GISS record cited July 2016, is no where near the warmest month ever recorded, or even this year.
http://data.giss.nasa.gov/gistemp/tabledata_v3/GLB.Ts+dSST.txt
It was within the GISS the highest July ever by .1 C, but .48 C lower than February of this year.

Surely you have been staring at the figures too closely for too long.

Febuary was warmer by comparison with other Febuaries rather than in absolute terms??????
 
We have been over this, the anomaly numbers for a month have little meaning unless the monthly baselines are published.
GISS is free to say whatever they want, but unless they provide the necessary baselines, their statement cannot be verified.
NOAA publishes baselines, shouldn't the GISS?

So you're saying they are lying.

It's a giant conspiracy by GISS, than.
 
Surely you have been staring at the figures too closely for too long.

February was warmer by comparison with other Febuaries rather than in absolute terms??????

February was a fluke in my area. Yesterday, I looked at my electric bill. It provides a bar graph by month for my electric usage. I used about 25% less electricity, probable for heating the place, than January and march. It only had a few less days. Not 25% less days.
 
Today's Yahoo page has an article titled,
https://www.yahoo.com/news/m/cb212fc4-097d-395c-af85-821d153aa4f3/a-warming-world:-july-marks.html

and

So what is wrong with the statement?
Well in the GISS record cited July 2016, is no where near the warmest month ever recorded, or even this year.
http://data.giss.nasa.gov/gistemp/tabledata_v3/GLB.Ts+dSST.txt
It was within the GISS the highest July ever by .1 C, but .48 C lower than February of this year.

That's pretty bad there Longview. You are better than that. Anomalies are not absolute temperature and you should know that. Just trying to stir up the pot a little are we?
 
We have been over this, the anomaly numbers for a month have little meaning unless the monthly baselines are published.
GISS is free to say whatever they want, but unless they provide the necessary baselines, their statement cannot be verified.
NOAA publishes baselines, shouldn't the GISS?

The baseline is irrelevant to delta. Any baseline can be used. GISS is using 1951-1980.
 
We have been over this, the anomaly numbers for a month have little meaning unless the monthly baselines are published.
GISS is free to say whatever they want, but unless they provide the necessary baselines, their statement cannot be verified.
NOAA publishes baselines, shouldn't the GISS?

You're argument boils down to three conclusions. We don't need to indulge in the mental gymnastics of your argument here. Please tell us which conclusion you arrive at:

1) GISS (NASA) is lying, despite clearly making data available to the public.

2) you've uncovered a mistake, whereas no other person who works closely with this data has noticed it.

3) you don't know WTF you're talking about.
 
February was a fluke in my area. Yesterday, I looked at my electric bill. It provides a bar graph by month for my electric usage. I used about 25% less electricity, probable for heating the place, than January and march. It only had a few less days. Not 25% less days.

Yes but that was still heating not AC.
 
Surely you have been staring at the figures too closely for too long.

Febuary was warmer by comparison with other Febuaries rather than in absolute terms??????
The problem is that we do not know, because the GISS does not publish the monthly baselines,
so their saying something related to month to month comparisons, has little meaning, and cannot be validated.
 
So you're saying they are lying.

It's a giant conspiracy by GISS, than.
Read much, because you comprehend even less! did I say they were lying?
the anomaly numbers for a month have little meaning unless the monthly baselines are published.
GISS is free to say whatever they want, but unless they provide the necessary baselines, their statement cannot be verified.
I said they do not provide enough information to verify their statements.
 
That's pretty bad there Longview. You are better than that. Anomalies are not absolute temperature and you should know that. Just trying to stir up the pot a little are we?
I konw, I was thinking of the annual J-D anomalies which used to have a baseline of 14C,
but upon looking at it, without a published monthly baseline, the numbers attached to the monthly readings
by the GISS cannot be verified in their relation to other months.
Here is a NOAA statement.
The combined average temperature over global land and ocean surfaces
for April 2016 was 1.10°C (1.98°F) above the 20th century average of 13.7°C (56.7°F)
They clearly understand the concept.
It is not that GISS is wrong, it is just that they do not provide the monthly average necessary for a comparison.
 
The baseline is irrelevant to delta. Any baseline can be used. GISS is using 1951-1980.
Actually it is not,
From the GISS data, what is say the 1951-1980 baseline for July and February?
From the data it is an average of the anomalies, without a baseline it cannot be compared to another month, in any meaningful way.
 
You're argument boils down to three conclusions. We don't need to indulge in the mental gymnastics of your argument here. Please tell us which conclusion you arrive at:

1) GISS (NASA) is lying, despite clearly making data available to the public.

2) you've uncovered a mistake, whereas no other person who works closely with this data has noticed it.

3) you don't know WTF you're talking about.
Again, poor comprehension! I am just saying there is insufficient data from GISS to verify their statements
related to month to month comparisons.
 
Again, poor comprehension! I am just saying there is insufficient data from GISS to verify their statements
related to month to month comparisons.

So they are lying then.

Or is it that you can't verify if they are lying, so you suspect they are?

And if they provide the data you want, why will you believe that without demanding the raw data behind what they are releasing- in other words, all the data so you can run it through your own verification system to check if they calculated the anomalies and baselines correctly?
NOAA supported their statement with baselines, should not the GISS do the same?
 
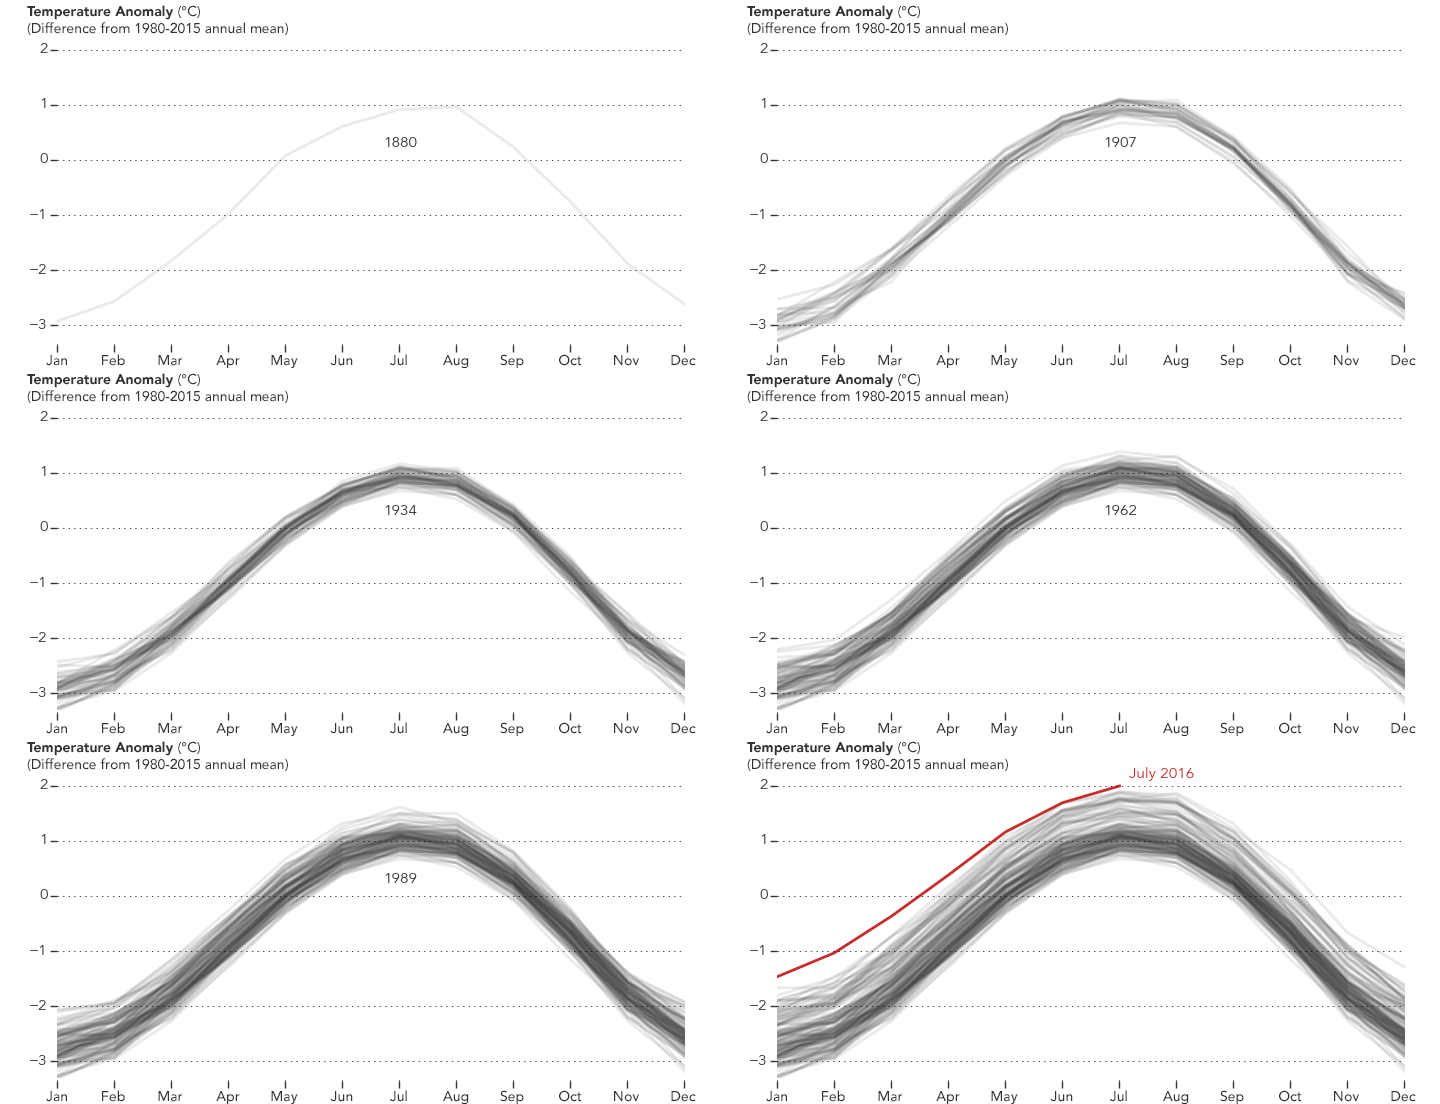
July 2016 Was the Hottest Month on Record : Image of the Day

monthlyanoms_gis_201607.gif
 
[h=2]Record hottest year means record bumper wheat crop, opposite of crop models[/h]
Last year there were warnings from crop modelers in Nature that heat kills wheat and yields were going to fall in the “near future”, if temperatures rose. In fact global warming was “already slowing wheat gains”. What followed was a record El Nino, and 2015 was the hottest ever year, with 2016 vying to beat it. But instead of wheat doom, this month the USDA forecasts a record yield of wheat with bumper crops globally. Wheat output has grown in Australia, the US, Russia, Ukraine, everywhere pretty much, except the EU where it has been too rainy. Where are the mea culpas? h/t to the GWPF
Jan 2015, published in Nature. “Global Wheat Yield May Drop as Temperatures Rise”
“… researchers are now letting farmers know that the world’s wheat yields are excepted decline in the near future, with the world standing to lose six percent of its wheat crop for every degree Celsius that the annual global temperature increases.
“The simulations with the multi-crop models showed that warming is already slowing yield gains, despite observed yield increases in the past, at a majority of wheat-growing locations across the globe,” researcher Senthold Asseng, at the University of Florida, explained in a statement.”
August 2016: USDA projects 743m ton wheat production from 2016/2017 year
USDA current August forecast is for 743 million tons, up from 734 million last year (estimated).
Looks like yet another global warming disaster:

 
Back
Top Bottom