• This is a political forum that is non-biased/non-partisan and treats every person's position on topics equally. This debate forum is not aligned to any political party. In today's politics, many ideas are split between and even within all the political parties. Often we find ourselves agreeing on one platform but some topics break our mold. We are here to discuss them in a civil political debate. If this is your first visit to our political forums, be sure to check out the RULES. Registering for debate politics is necessary before posting. Register today to participate - it's free!

July 2016 Jobs Report: 255,000 Jobs Added

Visbek

Stuck In The Circle
DP Veteran
Joined
Nov 28, 2011
Messages
23,246
Reaction score
18,234
Gender
Undisclosed
Political Leaning
Other
Strong U.S. employment report brightens economic outlook | Reuters

July jobs number is an all-around win.

• 255k jobs added, wildly beating the expected 180k
• June revised up to 290k jobs added
• Unemployment stays at 4.9%
• Labor force participation rate inched up
• Wages inched up
• U6 is still holding at 9.6% (which is 1% lower than June 2015)

“This was everything you could have asked for, maybe more,” said Michelle Meyer, head of United States economics at Bank of America Merrill Lynch.
 
It's good to see our economy slowly improving despite the horrible policies of Obama.
 
Well with all the seasonal jobs...... :2razz:
 
I did seem to get my burger and fries quicker than usual today.
 
Depending on which economist you listen to, we need to create somewhere around 145,000 jobs each month just to keep up with population growth. Add to that, the jobs needed to replace jobs eliminated by business closings, and a myriad of other factors, we need to create an average of 150,000 to 200,000 jobs each month to be in a positive position. The down turn in workforce participation rate is not a mitigating factor as many may think, because that increases government spending on new program recipients which puts a higher tax burden on workers and companies which lessens the amount of investment available to create more jobs.

255,000 jobs barely does that.
 
Meanwhile, black employment continues to decline.
 
Depending on which economist you listen to, we need to create somewhere around 145,000 jobs each month just to keep up with population growth.
Mostly true.
Add to that, the jobs needed to replace jobs eliminated by business closings, and a myriad of other factors, we need to create an average of 150,000 to 200,000 jobs each month to be in a positive position.
Ummm, the 255,000 is net change of jobs.


The down turn in workforce participation rate is not a mitigating factor as many may think, because that increases government spending on new program recipients which puts a higher tax burden on workers and companies which lessens the amount of investment available to create more jobs.
Where are you getting the idea that lower labor force participation means a greater number of "program recipients? (What program, by the way?)
 
Depending on which economist you listen to, we need to create somewhere around 145,000 jobs each month just to keep up with population growth.
Yes, and July beat that by about 100k. June was also up.


Add to that, the jobs needed to replace jobs eliminated by business closings, and a myriad of other factors, we need to create an average of 150,000 to 200,000 jobs each month to be in a positive position.
Incorrect.

Every month, millions of jobs are created and destroyed. This measure indicates that 250k more jobs were created than destroyed last month. That's why LFPR ticked up slightly.

Population definitely matters (as you noted), but there is no additional Cosmological Employment Constant that you can employ as a wet blanket on a good jobs report.


The down turn in workforce participation rate is not a mitigating factor as many may think, because that increases government spending on new program recipients which puts a higher tax burden on workers and companies which lessens the amount of investment available to create more jobs.
What the....?

1) LFPR improved this month, and has held steady for about a year now iirc.

2) Taxes do not magically go up because of safety net spending. Tax rates only go up when legislators choose to increase them.

3) If social spending increases faster than an increase in tax revenues, we borrow to make the difference.

4) There is zero sign of either taxes or government borrowing crowding out credit or capital.


This is almost all positive news, and good news for the economy. Trying to spin this to a negative is slightly ridiculous.
 
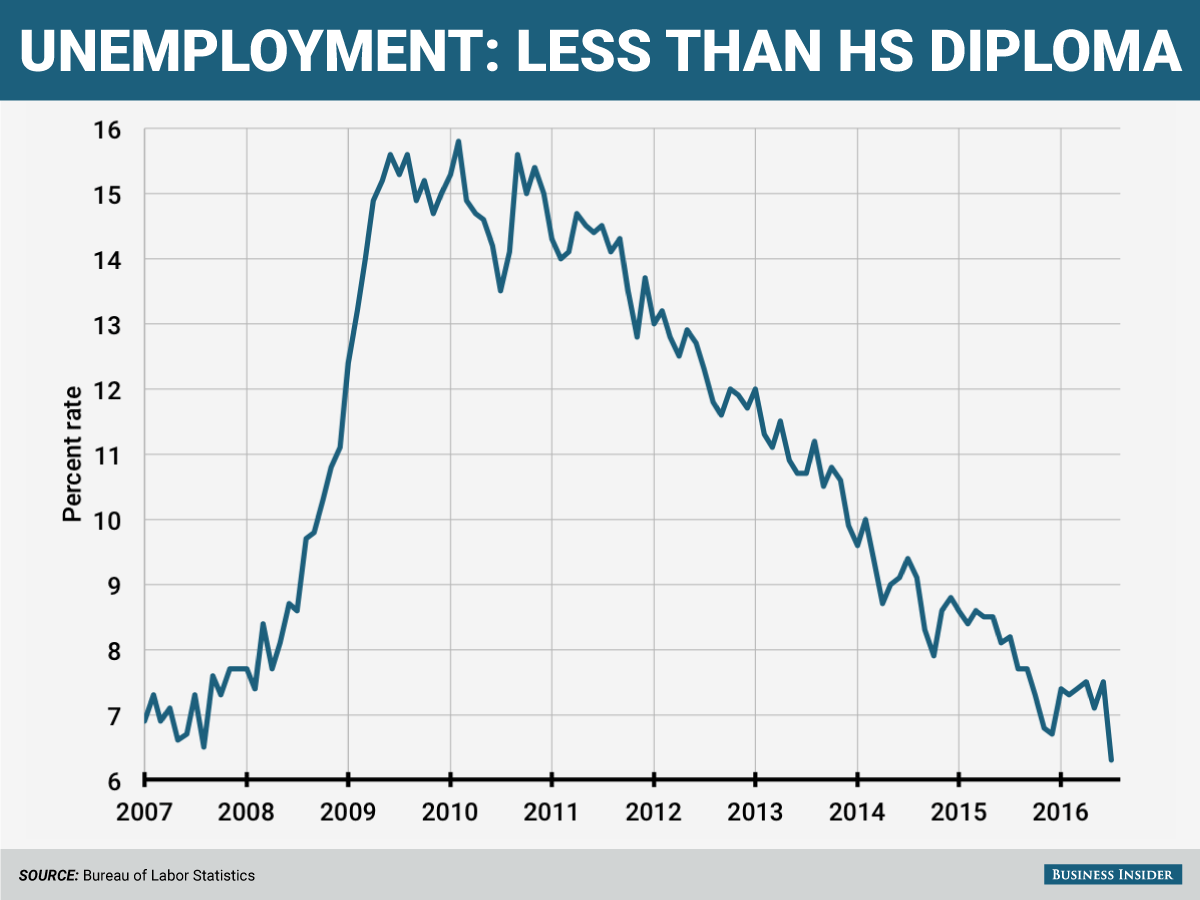
Unemployment for people without a high school diploma has been dropping, and is (finally) back to pre-recession rates. As in, "peak of bubble" rates. We could see wages going up more substantially soon, fingers crossed.

no-hs-diploma-uer-init.png
 
Strong U.S. employment report brightens economic outlook | Reuters

July jobs number is an all-around win.

• 255k jobs added, wildly beating the expected 180k
• June revised up to 290k jobs added
• Unemployment stays at 4.9%
• Labor force participation rate inched up
• Wages inched up
• U6 is still holding at 9.6% (which is 1% lower than June 2015)

“This was everything you could have asked for, maybe more,” said Michelle Meyer, head of United States economics at Bank of America Merrill Lynch.

Where are you reading this?

The U-6 rose to 9.7% (up 0.1%) and it has dropped 0.7% since last July, not a full 1%.

And I believe the U-6 should be the official unemployment rate as the U-3 (as the official rate) is a joke (IMO).

Table A-15. Alternative measures of labor underutilization


The Establishment survey is one thing. The Household survey - which the official unemployment rate is based on - is another.

For this month, it was great - in the seasonally adjusted figures (though I bet you this month's figures will eventually be adjusted downwards). But overall since March, employment gains have been lousy...less then 50,000 per month.

And if you look at the unadjusted numbers, July was a lousy month overall. Sure, the economy gained 447,000 newly employed. But those gains went to 16-19 year olds (492K - summer jobs) and seniors (78K)...hardly stellar, well paying jobs with bright futures.
The far more important 20-24's and especially 25-54's (the heart of the economy) both had less people employed in July then in June.
Teenagers gaining jobs while 25-54's are losing jobs is NEVER good for an economy.

Table A-9. Selected employment indicators

So I would not get too ga ga about July's jobs report were I you.


As always with government announcements...ALWAYS look past the headlines.
 
Last edited:
Where are you reading this?

The U-6 rose to 9.7% (up 0.1%) and it has dropped 0.7% since last July, not a full 1%.

And I believe the U-6 should be the official unemployment rate as the U-3 (as the official rate) is a joke (IMO).


For this month, it was great - in the seasonally adjusted figures (though I bet you this month's figures will eventually be adjusted downwards).

But overall since March, employment gains have been lousy...less then 50,000 per month.

And if you look at the unadjusted numbers, July was a lousy month overall. Sure, the economy gained 447,000 newly employed. But those gains went to 16-19 year olds (492K - summer jobs) and seniors (78K)...hardly stellar, well paying jobs with bright futures.
The far more important 20-24's and especially 25-54's (the heart of the economy) both had less people employed in July then in June.
Teenagers gaining jobs while 25-54's are losing jobs is NEVER good for an economy.

Table A-9. Selected employment indicators

So I would not get too ga ga about July's jobs report were I you.


As always with government announcements...ALWAYS look past the headlines.
While I agree that one should always look past the headline, one also has to be able to understand what the data mean.

Does or does not the U-3 accurately measure the percent of the labor force that is unemployed?

Why do you think July's employment level from the household survey will be revised downward in January? Are you aware of how revisions like that are arrived at?

If you're looking at not seasonally adjusted data, you can only compare each month to the same month in other years. How does July's drop compare to previous years?
 
Back
Top Bottom