- Joined
- Jan 28, 2013
- Messages
- 94,823
- Reaction score
- 28,342
- Location
- Williamsburg, Virginia
- Gender
- Male
- Political Leaning
- Independent
No, Buzz knows when he is being lied to, as do I.
No, you actually don't know what you're talking about.

No, Buzz knows when he is being lied to, as do I.
Facts??
:lamo
Do you seriously think "NCEP is NCEP" proves anything? Sorry, Jack... that is just as stupid of a statement as "The data is the data".
And your own often-repeated line: "2016>2017>2018<El Nino 2019>2020" proves you wrong with that 1 little "<".
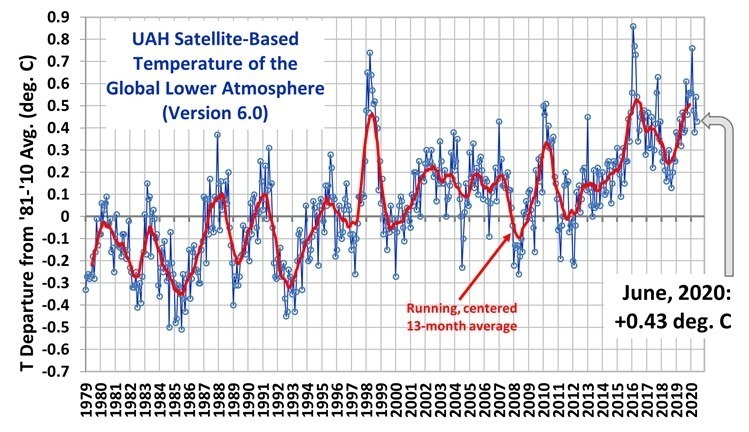
[h=2]UAH Global Temperature Update for June 2020: +0.43 deg. C[/h]July 2nd, 2020The Version 6.0 global average lower tropospheric temperature (LT) anomaly for June, 2020 was +0.43 deg. C, down from the May, 2020 value of +0.54 deg. C.
Even the satellites are seeing warming!
I you want to claim NCEP is putting out false data, please go ahead.
Jack Hays said:As for the one "<" please recall I always said the occasional El Nino could pause the cooling.
That is not what I said. Is that all you can do, Jack? Lie about what I said?
And just because you started claiming El Ninos would cause more warming after it started warming again doesn't make it o.k. for you to lie and say there is or has been no warming since 2016.
Then I'm not sure what you said if you weren't denigrating the NCEP data.
Jack Hays said:Temperature now is not higher than 2016. Thus, no warming.
Oh... so you think you can cite whatever numbers you want as long as you can use addition or subtraction to derive the number from a source with no explanation of how you came up with it.
:lamo
I think you are just desperate to not have to admit you were wrong about what they "clearly" listed.
For God's sake, long... I know what you are trying to do. You repeating the same thing over and over again doesn't add anything to the debate. So... please spare us all the unnecessary repetition.
You are not really going to try and make a big deal about the less than 1/10 of 1% of the change in total solar irradiation again while neglecting to include cooling from volcanoes... are you? And did you remember to divide that calculation of solar warming by 4? Of course not.
When you chose to pick an offset point like this, all you are doing is removing the difference between the two records at that point and making it look like all of the rest of the records are off by that much. It is nothing but a trick you are using to make the two records look more divergent than they really are.
You are taking your numbers from a 120-month running mean of monthly temperatures. And you chose the month of January to get your numbers from. That is all I was saying.
Oh God! Not your "averaged out" fallacy again!
Sorry, long... we have gone over this several times. Just because you can use averaging in a graph of temps to hide a spike(whether up or down) does not mean that that spike didn't happen and can just be ignored or left out of your calculations. This is nothing but unscientific BS.
I think you are forgetting that the warming you are initially calculating is from an increase in CO2. And that warming in and of itself is not causing a further increase in CO2. At least not directly.
Now you are just throwing **** at the wall and seeing what will stick.
:lamo
Also my selection, says nothing about January!#Averaged with 120-sample running mean
1855 -0.404858
1855.08 -0.402167
1855.17 -0.40375
1855.25 -0.407117
1855.33 -0.405042
1855.42 -0.402092
1855.5 -0.4014
1855.58 -0.401858
1855.67 -0.401558
1855.75 -0.399883
1855.83 -0.397117
1855.92 -0.396475
If you are unable to understand what I am saying then maybe you shouldn't be debating climate science.
Not higher than 2016 but higher than 2017 and 2018. In other words... warming.
The downward trend continues.
2016>2017>2018<El Nino 2019>2020.
EXTREME HEATNew Climate Summary: Heatwaves Are LESS Frequent and Severe
[FONT=&]July 31, 2020
[/FONT]
Ocean temperatures along the East Coast are near or above their warmest levels on record for this time of year, and they are not only drawing in unusual sea creatures but also helping to fuel the busiest Atlantic hurricane season on record to date.
Temperatures off the Northeast coast are 5.4 to 7.2 degrees above normal, said Andrew Pershing, chief scientific officer at the Gulf of Maine Research Institute, in an email.

More BS, eh?
Here are the facts.
Hot ocean waters along East Coast are drawing in ‘weird’ fish and supercharging hurricanes
More BS, eh?
Here are the facts. . . .


first time in 70 years no pacific typhoon forms in july… alarmists alarmed typhoon trend falling!
by p gosselin on 1. August 2020
share this...
this year is the first time since 1951 the pacific sees no typhoons in the month of july. Typhoons have seen downward trend since 1951.
donate - choose an amount
5101520501002505001000
by kirye
and pierre gosselin
global warming alarmists like to claim that tropical storms will intensify and become more frequent unless people stop using fossil fuels.
And recently these alarmists have had our attention steered to the atlantic basin, where tropical storms this year have seen quite an active season thus far.
Another reason the focus has been on the atlantic is because very little has been happening in terms of pacific typhoons, and the alarmists don’t want to talk about that.
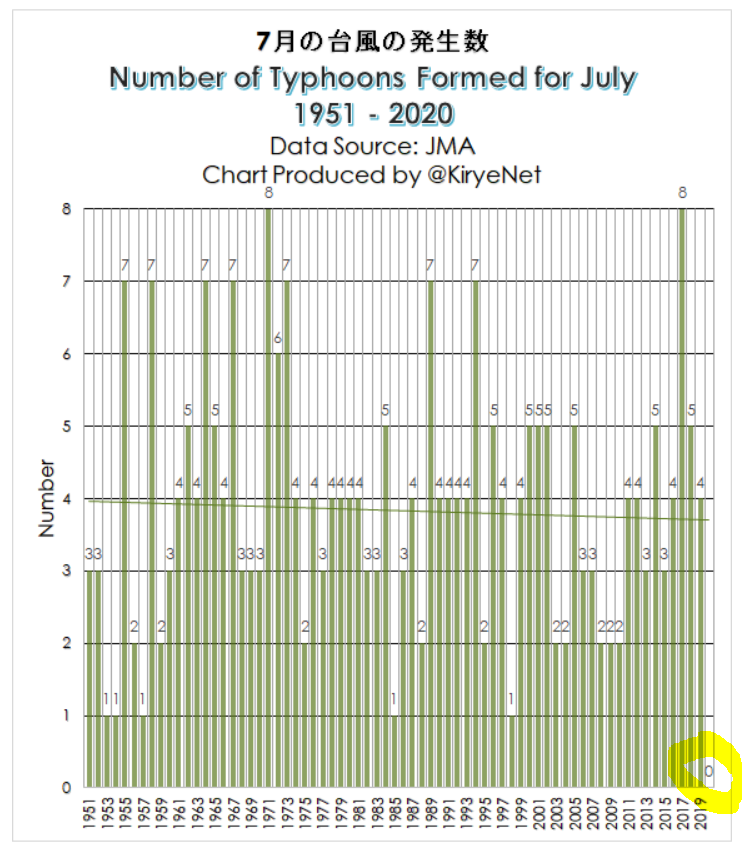
In fact this july is the first july to have seen no typhoons formed in the pacific at all since statistics on this began in 1951, according to the data from the japan meteorological agency (jma).
normally between 3 to 4 typhoons form in the pacific in july. Up to 8 have formed in the past, e.g. On 2017 and 1971. But this year july failed to see a single typhoon form – the first time this has occurred since 1951. . . .
but one year does not make a trend. Global warming alarmists say storms are getting and will be more frequent, and stronger. So let’s look at the data here as well.
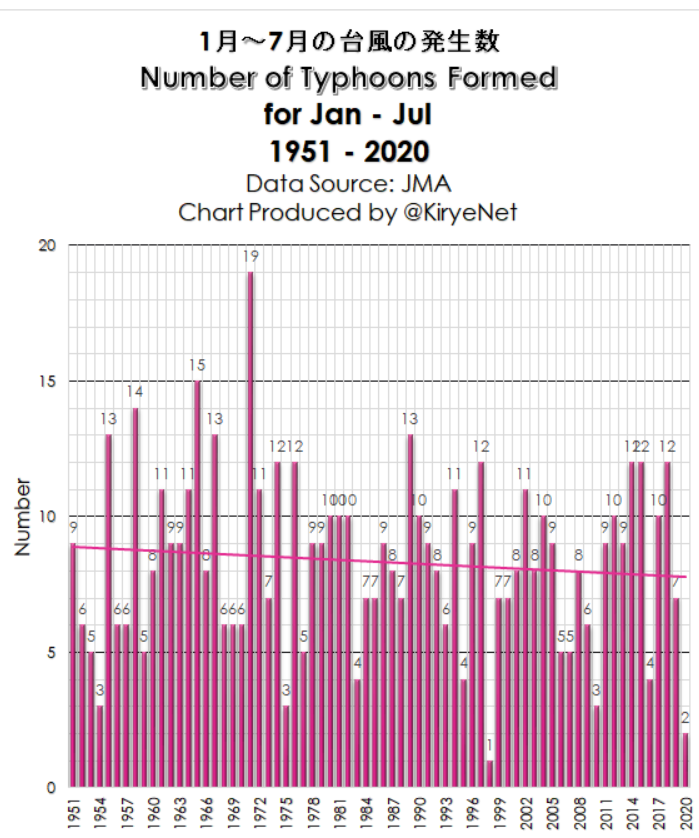
the following chart shows the number of typhoons formed in the pacific each year from january to july, since 1951:
contrary to what global warming alarmists say, the trend has been downward! The year 2020 has been the second quietest on record – so far. . . .
c&p, dnr.
Your ignorance is your prison.
Do better than posting C&P trash.
[h=2]New Study: Rising CO2 Drives Post-1980s Greening…Which Cools The Earth And Offsets 29% Of Human Emissions[/h]By Kenneth Richard on 6. August 2020
Share this...
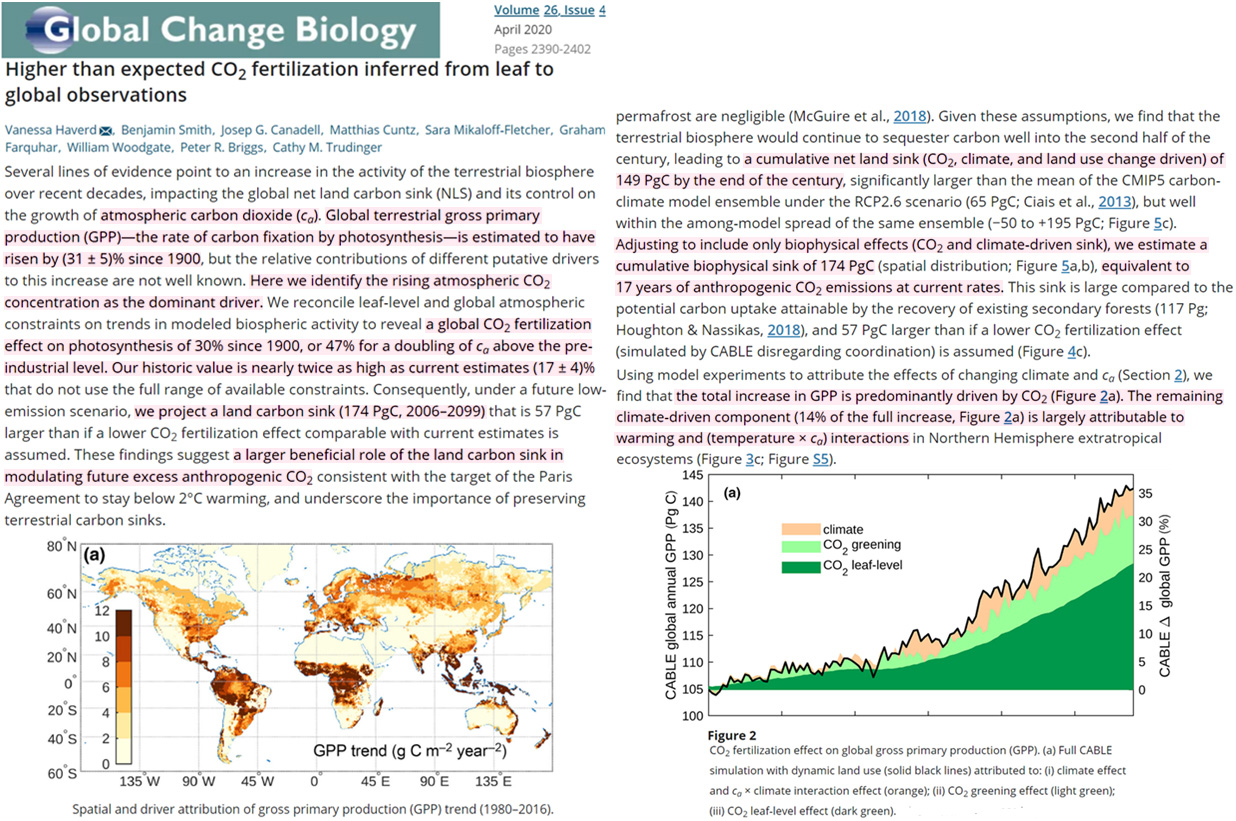
[h=4]About 70% of the Earth’s post-1980s vegetative greening trend has been driven by CO2 fertilization. More greening has offset or reversed 29% of recent anthropogenic CO2 emissions. Greening also has a net cooling effect on surface temperatures.[/h]Earlier this year we highlighted a study (Haverd et al., 2020) asserting rising CO2 and warming are the dominiant drivers of Earth’s strong post-1980s greening trend. This greening expands Earth’s carbon sink so profoundly that by 2100 the greening of the Earth will offset 17 years (equivalent) of anthropogenic CO2 emissions.
A 17% offset over 80 years, or net CO2 emissions reversal, would easily supplant the effectiveness of Paris climate accord CO2 mitigation policies.
[h=6]Image Source: Haverd et al., 2020[/h]
So global cooling is under way, but rising CO2 and warming are the dominant drivers of Earth’s strong post-1980s greening trend.
Do you actually not care that your posts contradict one another?
 The Test and Failure of the AGW Paradigm[/h]
There is nothing in that post that contradicts my basic view.
►[h=3]
So what is your basic view? That global cooling is under way as per your OP dated January 2013, or that rising CO2 and warming are the dominant drivers of Earth’s strong post-1980s greening trend as per that post? They can't both be true - the Earth cannot be simultaneously cooling and warming!

Of course they can both be true. Cooling trend began in 2016 (not 2013 per your error). Warming before that.