• This is a political forum that is non-biased/non-partisan and treats every person's position on topics equally. This debate forum is not aligned to any political party. In today's politics, many ideas are split between and even within all the political parties. Often we find ourselves agreeing on one platform but some topics break our mold. We are here to discuss them in a civil political debate. If this is your first visit to our political forums, be sure to check out the RULES. Registering for debate politics is necessary before posting. Register today to participate - it's free!

Employers add no net jobs in Aug.; rate unchanged

Status
Not open for further replies.
Total employment is total employment. The claim was there are less jobs than when this administration began (as a strawman mind you), which is simply untrue. What explicitly are you stating that is "negative"?

The report I posted showed that by any measurement there is less employment today than February 2009, your link did not work.
 
Moderator's Warning:
It's getting to be that time again folks. Get those final arguments in, this thread is closing soon due to approaching 2k posts.
 
Moderator's Warning:
It's getting to be that time again folks. Get those final arguments in, this thread is closing soon due to approaching 2k posts.

What if we give you kitty treats :2razz:
 
The problem with this Administration is that any benefits are offset by expenses on the other side, expenses like regulations, potential tax hikes, Obamacare. No business is going to hire with the uncertainties created by this Administration.

Regulation Nation: Drowning In Rules, Businesses Brace For Cost And Time For Compliance | Fox News

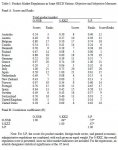
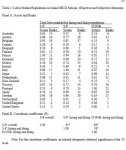
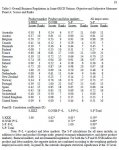
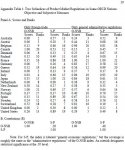
Can regulations be improved? Yes. America is noted for having some of the best business regulations in the world. By the way ... trash Obamacare and start again. Nicoletti Pryor -SUBJECTIVE AND OBJECTIVE MEASURES OF GOVERNMENTAL REGULATIONS IN OECD NATIONS* below.

www.swarthmore.edu/SocSci/Economics/fpryor1/Nicoletti Pryor Essay.pdf
Regs 1.jpgregs 2.jpg
reg 3.jpgregs 4.jpg
 
The report I posted showed that by any measurement there is less employment today than February 2009, your link did not work.

My source is correct:

source121.jpg
 
Last edited:

So you say, I disagree

Labor Force Statistics from the Current Population Survey
Original Data Value

Series Id: LNS12000000
Seasonally Adjusted
Series title: (Seas) Employment Level
Labor force status: Employed
Type of data: Number in thousands
Age: 16 years and over
Years: 1980 to 2011

Year Jan Feb Mar Apr May Jun Jul Aug Sep Oct Nov Dec

2009 142201 141687 140822 140720 140292 139978 139794 139409 138791 138393 138590 137960
2010 138511 138698 138952 139382 139353 139092 138991 139267 139378 139084 138909 139206
2011 139323 139573 139864 139674 139779 139334 139296 139627

Why don't you provide a link. I mean really.
 
I did provide the link, too bad you ignored it.

No you did not. This is your post copy and pasted in its entirety:
So you say, I disagree

Labor Force Statistics from the Current Population Survey
Original Data Value

Series Id: LNS12000000
Seasonally Adjusted
Series title: (Seas) Employment Level
Labor force status: Employed
Type of data: Number in thousands
Age: 16 years and over
Years: 1980 to 2011

Year Jan Feb Mar Apr May Jun Jul Aug Sep Oct Nov Dec

2009 142201 141687 140822 140720 140292 139978 139794 139409 138791 138393 138590 137960
2010 138511 138698 138952 139382 139353 139092 138991 139267 139378 139084 138909 139206
2011 139323 139573 139864 139674 139779 139334 139296 139627

There is no link in that. And with your record of confusing things like nominal and real numbers your cred is about that of a Nigerian lottery.
 
No you did not. This is your post copy and pasted in its entirety:


There is no link in that. And with your record of confusing things like nominal and real numbers your cred is about that of a Nigerian lottery.

It is a discrepancy between seasonal and non seasonal adjustment. Seasonal adjustment is important when comparing ratio's i.e. the unemployment rate.

Now let the new argument begin!
 
It is a discrepancy between seasonal and non seasonal adjustment. Seasonal adjustment is important when comparing ratio's i.e. the unemployment rate.

Now let the new argument begin!

Yes, I posted the employment number from data used to calculate the unemployment rate, here is the link for the Employment numbers showing employment numbers, non farm payroll. We are going to run out of room on this one, catch you in another forum

Top Picks (Most Requested Statistics) : U.S. Bureau of Labor Statistics
 
You have 89 more post to show that your right, good god man how much time do you need?:shock:


That is the link and when you check the employment link you will find the following:

Employment, Hours, and Earnings from the Current Employment Statistics survey (National)
Original Data Value

Series Id: CES0000000001
Seasonally Adjusted
Super Sector: Total nonfarm
Industry: Total nonfarm
NAICS Code: -
Data Type: ALL EMPLOYEES, THOUSANDS
Years: 2001 to 2011

Year Jan Feb Mar Apr May Jun Jul Aug Sep Oct Nov Dec
2001 132469 132530 132500 132219 132175 132047 131922 131762 131518 131193 130901 130723
2002 130591 130444 130420 130335 130328 130373 130276 130260 130205 130331 130339 130183
2003 130266 130108 129896 129847 129841 129839 129864 129822 129925 130128 130146 130270
2004 130420 130463 130801 131051 131361 131442 131489 131610 131770 132121 132185 132317
2005 132453 132693 132835 133195 133364 133610 133979 134174 134237 134321 134655 134813
2006 135094 135411 135698 135880 135891 135971 136173 136358 136514 136506 136711 136891
2007 137094 137182 137400 137479 137620 137687 137638 137612 137681 137772 137899 137983
2008 137996 137913 137841 137656 137423 137245 137014 136747 136313 135804 135002 134383
2009 133563 132837 132041 131381 130995 130493 130193 129962 129726 129505 129450 129320
2010 129281 129246 129438 129715 130173 129981 129932 129873 129844 130015 130108 130260
2011 130328 130563 130757 130974 131027 131047 131132 131132


Geten the random number hotkey loosened up for the new thread eh?:mrgreen:
 
Geten the random number hotkey loosened up for the new thread eh?:mrgreen:

I gave you the link and posted the chart, what else do you want to see. 131.1 is less than 133.6 or 132.8 if you use February's numbers
 
I gave you the link and posted the chart, what else do you want to see. 131.1 is less than 133.6 or 132.8 if you use February's numbers

I,m kinda lazy tonight, i want the page in its context.In plain English a link would be nice.
Baring that i will just set here sipping my coffee and be snarky until this thread dies a quite death and we move onto greener pastures.:mrgreen:
 
I,m kinda lazy tonight, i want the page in its context.In plain English a link would be nice.
Baring that i will just set here sipping my coffee and be snarky until this thread dies a quite death and we move onto greener pastures.:mrgreen:

BLS will not let you post the direct link to the chart, get a good nights sleep, click on the link I gave you and put a checkmark in the employment box and see what it shows you.
 
BLS will not let you post the direct link to the chart, get a good nights sleep, click on the link I gave you and put a checkmark in the employment box and see what it shows you.

Which set of books did the link go to?:confused:
 
Hhmm...if i go rummaging through all 192 pages of this thread, i will find that the only citations of employment made by you will be from "Total Nonfarm Employment "is that a big ten four?

Total non farm payroll excludes public sector jobs so what do you want me to include?
 
BLS will not let you post the direct link to the chart, get a good nights sleep, click on the link I gave you and put a checkmark in the employment box and see what it shows you.
Of course it does ... if you know what you're doing ...


Total nonfarm


... I hope you're taking notes for these lessons, Con. How does it feel to get constantly schooled by a Liberal?
 
No, I blame Obama for the economic results of 2010 and 2011 as it was his economic policy that generated those results. Discouraged workers are his responsibility and the loss in consumer and business confidence is his responsibility. This is the Obama economy and the results are a disaster
Still waiting for an answer, Con ...

Why do you claim Obama's results gave us 3 million additionally underemployed since you have to start counting from February 1st, 2009, to reach? Seems to me you are attributing job loses to him that even you don't believe belong to him.
 
Of course it does ... if you know what you're doing ...


Total nonfarm


... I hope you're taking notes for these lessons, Con. How does it feel to get constantly schooled by a Liberal?

Thanks for showing that non farm payroll jobs were down as confirmed by the chart I posted.
 
Still waiting for an answer, Con ...

Why do you claim Obama's results gave us 3 million additionally underemployed since you have to start counting from February 1st, 2009, to reach? Seems to me you are attributing job loses to him that even you don't believe belong to him.

Obama's results are public record and since he was in the Congress yes, he is responsible for the job losses in February 2009
 
Status
Not open for further replies.
Back
Top Bottom