- Joined
- Jan 25, 2012
- Messages
- 44,709
- Reaction score
- 14,478
- Location
- Texas
- Gender
- Male
- Political Leaning
- Conservative
That is why I posted the graphic from the 2019 peer reviewed publication.WOW!! This is just completely wrong.
Neither the OHCTD nor EEI says anything is cooling. They both are, in fact, saying that the oceans and the Earth are both still warming. What is declining is the rate of warming. And at the rate of decline that we are seeing now, it will be decades before anything actually starts cooling. And there is nothing here that says that these declines in warming will continue long enough for cooling to even happen.
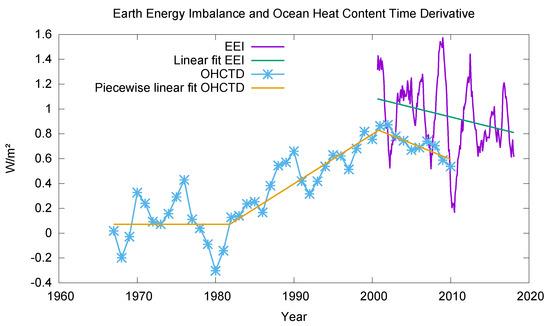
"Figure 15. Purple curve: running yearly mean EEI. Green line: linear fit to running yearly mean EEI. Blue curve: 10 year running mean OHCTD. Orange curve: piecewise linear fit to OHCTD.
Due to the high ocean heat content, it is expected that the EEI and the OHCTD are nearly equal. From Figure 15, we can discriminate three phases in the OHCTD from 1967 to 2010:
- Prior to 1982, the mean value of the OHCTD is 0.071 ± 0.05 (1 σ
- ) W/m2dec.
- From 1982 to 2000, the OHCTD is increasing with a trend of 0.32 ± 0.05 (1 σ
- ) W/m2dec.
- After 2000, the OHCTD is decreasing with a trend of −0.26 ± 0.06 (1 σ
- ) W/m2dec.
) W/m2dec), agree. This again adds extra confidence to our results. "
You would have to disagree with physics, to say the declining energy in a system, will not eventually
result in a lowering of temperature!