• This is a political forum that is non-biased/non-partisan and treats every person's position on topics equally. This debate forum is not aligned to any political party. In today's politics, many ideas are split between and even within all the political parties. Often we find ourselves agreeing on one platform but some topics break our mold. We are here to discuss them in a civil political debate. If this is your first visit to our political forums, be sure to check out the RULES. Registering for debate politics is necessary before posting. Register today to participate - it's free!

Daily and Weekly Statistical Summaries of COVID-19 NEW Thread

* * * Page 2 * * *
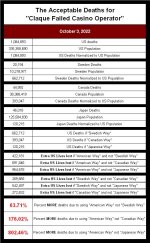
While it is true that if the US had followed “The Swedish Way” (which meant actually getting vaccinated – so THAT wasn’t going to happen) that would have saved around 422,181 (last Monday it was 420,619) lives, what the members of “Claque Failed Casino Operator” are actually saying is:

I’m OK with an additional 269,665 (last Monday it was 268,093) MORE Americans dying by going the ‘Swedish Way’ instead of ‘The Canadian Way’.
[That is a total of an EXTRA 691,846 (last Monday it was 688,711) deaths.]

AND

I’m OK with an additional 542,497 (last Monday it was 542,612) MORE Americans dying
by going the ‘Swedish Way’ instead of ‘The Japanese Way’.
[That is a total of an EXTRA 964,678 (last Monday it was 963,230) deaths.]

— BUT —

Them Kanookz, Japz an Sweedz are geddin vaxxuhnadud and I’M NOT GONNA DOODAT!

22-10-03 H2 - ACCEPTABLE DEATHS.JPG
HOWEVER, on the “brighter(?)” side,

[1]according to the latest CDC data, 45.00% of the “LOAN” states are in the “Green” zone, as are 14.29% of the “MOAN” states, 0.00% of the “ROAN” states, and 19.61% of the country as a whole. That (42.50 + 7.14 + 0.00 + 19.61) equals 78.89% so that means that the US is 156.743% (CERTIFIED BY The Reliable Unquestionable Measuring People) closer to having 100% of its population vaccinated and boosted than Canada (with only 50.33% vaccinated and boosted), thus proving the total superiority of the American Healthcare System. And *D*O*C*T*O*R* Mashmont says that means that COVID-19 doesn’t exist in the US any more (if it ever did).

22-10-03 J3 - STATE VAX RATES.JPG
[2] “The Red Team” is pushing desperately to try and meet its “1,250,000 Dead by National Harvey Wallbanger Day(08 NOV)” but it looks like it will need a strong dose of divine intervention) make to it so SEND YOUR PRAYER OFFERINGS to the Church of *D*J*T* NOW. [Receipts which you can file with the IRS available on request.]

AND

[3] the US

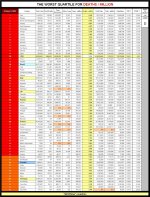
(a) (Graded at D) is doing 0.0049% better than Latvia (but only 0.0142% worse than Greece) and is the 16th worst country in the world with respect to “Deaths per Million”;

22-10-03 F5 - WORST 54 DEATHS per MILLION.JPG
(b) (Graded at C-) is doing a massive 0.0004% better than Bermuda[/B] (and only 0.0072% worse than Mongolia) with regard to “Cases per Million” and is the 58th worst country in the world on that metric. This means that the US is no longer in the BOTTOM QUARTER and is amongst the

TOP THREE
quarters of the
COUNTRIES IN THE WORLD
on this metric.


<SARC>
So who says that the US healthcare system (“the world’s best healthcare system”) which is doing much better than the 57 countries that have a commie “universal healthcare system” that are doing worse than it is isn’t competitive with that of the other “powerhouse” nations?
</SARC>
(c) “Mortality Rate (ALL) is a mere 103.90% of the Canadian one) shows that (according to “Mashmontian Math”) the US is doing almost 2 times (rounded to one significant figure) BETTER than Canada [because 103.90% is closer to 200.00% than it is to 0.00%];

and

(d) number of daily deaths continues to (allowing for the cyclic pattern arising from the fact that a lot of people in a lot of states don't think that what happens on the weekends is worth bothering to report as it happens) remain stable. This may well be the “New Normal” for COVID-19.
– FULLER REPORTS ON SATURDAYS –
 
Today's
QUIK-EE-REVU®

TUESDAY 04 OCT 22

<SARC>
WELCOME TO McCOVID’s – OVER 98,000,000 SERVED
The McCOVID’s ”BIG XCIX contest tickets are selling well
AND
are still available at all Big [R] outlets.

!!! HURRY – GET YOUR tickets NOW !!!
BUY SOME FOR YOUR KIDS, YOUR NEIGHBOURS, AND ALL YOUR RELATIVES

CONSERVATIVES
and all некультурный dolts

!*! REMAIN VIGILANT !*!

(or the bogyman will get you)
</SARC>

*********************************************************************************************

NOTE


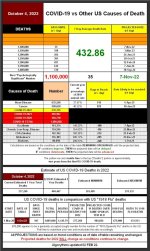
The “Red”/”Blue”/”Green” color codes refer to the rates on this day of the week last week and are not NECESSARILY indicative of long term trends UNLESS associated with an average.
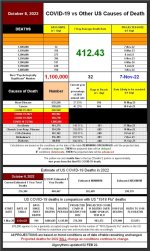
America’s performance against COVID-19 relative to the other “G-8+China” group remains consistently in the "Find someone else to blame for this crap and find them NOW!" area that it has been all along.

22-10-04 A2 - COVID vs Other Causes TABLE.JPG
And, when you compare the results with the countries’ abilities to pay to fight COVID-19,

22-10-04 G3 - ABILITY TO PAY.JPG
the US results don’t look all that “Exceptional” either. [On average, the countries/areas (excluding China, for which the data is largely fictional) are doing 59.16% better than the US is doing with regard to the chance a person chosen at random has of dying from COVID-19 than a person chosen at random in the US does.]

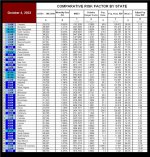
There has been no substantial change to the vaccination status of the several states and here is how they stack up for “Risk Factor” (“Chance of catching COVID-19” x “Chance of dying if you do”) adjusted for urbanization and population density.

22-10-04 C4 - RISK FACTOR TABLE.JPG
The seven day average deaths appear to have crested and to be inching downwards.

While it is true that if the US had followed “The Swedish Way” (which meant actually getting vaccinated – so THAT wasn’t going to happen) that would have saved around 422,338 (last Tuesday it was 420,923) lives,

what the members of “Claque Failed Casino Operator” are actually saying is:

I’m OK with an additional 267,695 (last Tuesday it was 268,097) MORE Americans dying by going the ‘Swedish Way’ instead of ‘The Canadian Way’.
[A total of an extra 690,032 (last Tuesday it was 689,020) deaths.]

AND

I’m OK with an additional 542,332 (last Tuesday it was 542,385) MORE Americans dying
by going the ‘Swedish Way’ instead of ‘The Japanese Way’.
[A total of an extra 964,670 (last Tuesday it was 963,308) deaths.]

– BUT –

Them Kanookz, Japz an Sweedz are geddin vaxxuhnaded and I’M’ NOT GONNA DOODAT!”​
 
* * * Page 2 * * *
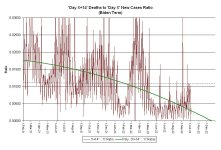
Even though the “14 days later” ratio (it takes about that long for someone to die from COVID-19 if they catch it) is still looking pretty good,

22-10-04 B2c2 - 14 Day Behind Ratio BIDEN.JPG
the US “COVID Burden” still looks uncomfortably bad because it LOOKS like the TIME FOR RECOVERY of the new cases SEEMS to be increasing.

NONE of the “G-8+China” group of countries remains in the “Worst 25” for “COVID-19 Burden”.

However:
  • France #28,
  • Germany #30,
  • Italy #33,
  • Japan #35,
  • the US #40, and
  • Russia #52,
are still in the worst quartile, while
  • the UK #78, and
  • Canada #80,
are out of the worst third (doing just a shade worse than the world average) but are still in the bottom half.

Sweden [NOT a G-8 country] is #77 and now back in the worst third.

Brazil, India, the ROK, and the DPRK have been added for interest’s sake only.

That leaves China (and its largely fictitious data) at #199 to complete the set.

22-10-04 H1 - COVID BURDEN.JPG
HOWEVER, on the “brighter(?)” side,

[1] The “Light At The End of the Tunnel” is that it appears that COVID-19 is running out of Trumpists to infect and kill (at least in the “Red” states).

[2] 45.00% of the “LOAN” states are in the “Green” zone, as are 14.29% of the “MOAN” states, 0.00% of the “ROAN” states, and 19.61% of all the states. That (45.00 + 14.29 + 0.00 + 16.61) equals 78.89% so that means that the US is closer to having 100% of its population vaccinated and boosted than Canada (with only 50.34% vaccinated and boosted [and when you apply the US/Canada exchange rate that 50.18% becomes a mere 37.69%]), thus, according to The University of Numberology, proving the total (78.89% + 37.69% = 116.65%) superiority of the American Healthcare System.

[3] “The Red Team” looks like it has a chance to meet its new goal of “1,250,000 Dead by ‘National Harvey Wallbanger Day’” (08 NOV 23)” but it looks like it will need a strong dose of divine intervention) make to it (rather than some later date - like National Fruitcake Day - ) so SEND YOUR PRAYER OFFERINGS to the Church of DJT NOW.

AND

[4] the US


(a) (Graded at D) is doing 0.0074% better than Latvia (but 0.0144% worse than Greece) and is STILL ONLY the 16th WORST country in the world with in “Deaths per Million”;

(b) (Graded at C-) is doing a massive 0.0001% better than Bermuda (and only 0.0074% worse than Mongolia) and is the 58th WORST country in the world in “Cases per Million”. The US is now OUT OF THE BOTTOM QUARTILE and is amongst the

TOP THREE
quarters of the
COUNTRIES IN THE WORLD
on this metric.


<SARC>
So who says that the US healthcare system (“the world’s best healthcare system”) which is doing much better than the 57 countries that have a commie “universal healthcare system” that are doing worse than it is isn’t competitive with that of the other “powerhouse” nations?
</SARC>
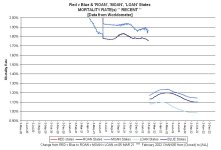
(c) “Mortality Rate (ALL) that had been rising again (more so in the “MOAN” and “ROAN” states) looks like it is starting to fall (which is a good sign) in all three groups of states. The drop is most noticeable in the “LOAN” states.

22-10-04 E3b - RvB Mortality RECENT GRAPH.JPG
This may be due to an increase in the severity of the lower number of new cases (but that’s an “EWAG”).

(d) “Mortality Rate” is ONLY 103.80% of the Canadian one, which shows that (according to “Mashmontian Math”) the US is doing almost 2 times BETTER than Canada [because 103.80% is closer to 200.00% than it is to 0.00%];

and

(e) number of daily deaths continues to (allowing for the cyclic pattern arising from the fact that a lot of people in a lot of states don't think that what happens on the weekends is worth bothering to report as it happens) improve.
– FULLER REPORTS ON SATURDAYS –
 
Today's
QUIK-EE-REVU®

WEDNESDAY 05 OCT 22

<SARC>
WELCOME TO McCOVID’s – OVER 98,000,000 SERVED
The McCOVID’s ”BIG XCIX tickets are selling fast,
BUT
are still available at all
”Big [R]” locations.
!!! HURRY – GET YOUR tickets NOW !!!
*** Surprise the kids with your gift that they will remember all their lives! ***

CONSERVATIVES and all некультурный dolts
!*! REMAIN VIGILANT !*!
(or the bogyman will get you)
</SARC>


*********************************************************************************************

NOTE


The “Red”/”Blue”/”Green” color codes refer to the rates on this day of the week last week and are not NECESSARILY indicative of long term trends UNLESS associated with an average.
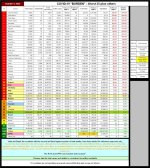
America’s performance against COVID-19 relative to the other “G-8+China” group remains consistently in the "The Cubs have the same chance of winning the Pennant this year as they had last year." area that it has been all along.

22-10-05 A2 - COVID vs Other Causes TABLE.JPG
The CURRENT number of projected COVID-19 deaths for 2022 is 68.67% of what it was on 01 JAN 22. This is DOWN from last week (by 0.01%).

The relative rates

22-10-05 A1 - G8 + CHINA COVID TABLE.JPG
don’t really look happy making.

There has been no substantial change to the vaccination status of the several states.

The seven day average death rate appears to have plateaued. Is this about what we can expect on a steady basis – just like any other disease. Or is there going to be another spike?

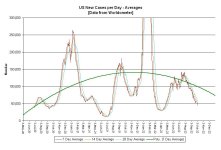
The US “New Cases per Day” graph (even with the slow down in the US vaccination rate) looks like there is a chance that a corner has been turned (I’m just not sure what that corner is).

22-10-05 C3 - US NEW CASES per day 7-14-28 GRAPH.JPG
and so does the “14 days later” ratio (it takes about that long for someone to die from COVID-19 if they catch it) but, since the mortality rate is not dropping as rapidly as the infection rate, it appears that the “fewer cases” are also “more serious cases” and so the US “COVID Burden” still looks uncomfortably bad.

NONE of the “G-8+China” group of countries remains in the “Worst 25” for “Covid Burden”,[/B] however:
  • France at #29,
  • Germany at #30,
  • Italy at #35,
  • Japan at #37, and
  • the US at #42,
remain in the bottom quartile of the 211 reporting countries.

Out of both the bottom quartile, but still in the bottom third is:
  • Russia at #47,
Out of the bottom third, but still in the bottom half are
  • the UK at #80, and
  • Canada at #81
both of which are doing better than the world average (#78).

The (mostly invented) Chinese data puts China at #200.

Sweden [NOT a G-8 country] is at #76 and well into the top half.

Those numbers are RELATIVE numbers and the actual “burden” appears to be decreasing due to the decrease in the severity of the average case (as indicated by the decline in the mortality rates).

The “Light At The End of the Tunnel” that sort of showed that COVID-19 was running out of Trumpists to infect and kill (except in the “ROAN” states) is somewhat dimmer.​
 
* * * Page 2 * * *
While it is true that if the US had followed “The Swedish Way” (which meant actually getting vaccinated – so THAT wasn’t going to happen) that would have saved around 422,633 (last Wednesday it was 421,158) lives, what the members of “Claque Failed Casino Operator” are actually saying is:

I’m OK with an additional 267,699 (last Wednesday it was 268,105) MORE Americans dying by going the ‘Swedish Way’ instead of ‘The Canadian Way’.
(A total of an EXTRA 690,332 [last Wednesday it was 689,264] deaths.)

AND

I’m OK with an additional 542,143 (last Wednesday it was 542,402) MORE Americans dying
by going the ‘Swedish Way’ instead of ‘The Japanese Way’.
(A total of an EXTRA 964,776 [last Wednesday it was 963,561 deaths.)

– BUT –

Them Kanookz, Japz an Sweedz are geddin vaxxuhnaded and I’m NOT GONNA DOODAT!
HOWEVER, on the “brighter(?)” side,

[1] When you add up the percentages for “LOAN”, “MOAN”, “ROAN”, and “All” states (45.00% + 14.29% + 0.00% + 19.61%) you find that 78.89% of them are “IN THE GREEN” and, *D*O*C*T*O*R* Mashmont [whose calculations are totally verified by the BS (Statistics) program at The University of Numberology] says that means that COVID-19 doesn’t exist any more (if it ever did) since 78.89% is closer to 100% than it is to 0.00%.

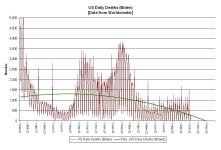
[2] “The Red Team” is struggling to make its new goal of “1,250,000 Dead by ‘National Harvey Wallbanger Day’” (08 NOV)” but it looks like it will need a strong dose of divine intervention) make to it (rather than some later date. (Any rumor that it was ever trying for any earlier date is typical left-wing, socialist, fascist, lying propaganda pushed by the commies who want to destroy America and turn it into a shit-hole third world country with that so-called “Universal Healthcare Insurance”.) But the current trend line

22-10-05 B2a3 - Daily Deaths BIDEN Years GRAPH.JPG
is against “Team Trump” in its “valiant effort” to rehabilitate President Trump’s predictions about the severity of COVID-19. The trend line for this graph is now a 5th order polynomial (it gives a better match to the data).

AND

[3] the US

(a) (Graded at D) is doing 0.0074% better than Latvia (but 0.0149% worse than Greece) and is the 16th worst country in the world with respect to “Deaths per Million”;

(b) (Graded at C-) on “Cases per Million

22-10-05 F4 - WORST 54 CASES per MILLION.JPG
is doing a massive 0.0212% better than French Guiana (and only 0.0001% worse than Bermuda) with regard to “Cases per Million” and is ONLY the 57th worst country in the world on that metric (but still in the bottom third).

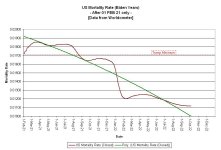
(c) “Mortality Rate (ALL)” appears to be SLOWLY decreasing.

22-10-05 B1c - Mortality Rate BIDEN Years GRAPH.JPG
This is driven, primarily, by the "LOAN" and "MOAN" states as the rate in the “ROAN” states continues to climb.

However it is a mere 103.81% of the Canadian one) shows that (according to “Mashmontian Math”) the US is doing almost 2 times BETTER than Canada [because 103.81% is closer to 200.00% than it is to 0.00%];

and

(d) number of daily deaths continues to (allowing for the cyclic pattern arising from the fact that a lot of people in a lot of states don't think that what happens on the weekends is worth bothering to report as it happens) appear to be settling into the “new normal”. However, an increase that parallels the annual pattern for influenza isn’t going to surprise anyone who is paying attention and is going to elicit howls of outrage from “Claque Failed Casino Operator”.

AND

(e) had (according to the last report from the head of the B.S. [Statistics] program at The University of Numberology) only an average of 275.06 deaths per day from COVID-19 while Mr. Trump was in office but has had an average of 1,254.79 deaths per day from COVID-19 while Mr. Biden has been in office, thus proving that Mr. Trump was 4.5618774085654039118737729949829 times better at dealing with COVID-19 that Mr. Biden has been.
– FULLER REPORTS ON SATURDAYS –
 
Today's
QUIK-EE-REVU®

THURSDAY 06 OCT 22

<SARC>
WELCOME TO McCOVID’s – OVER 98,000,000 SERVED
SOME McCOVID’s ”BIG XCIX tickets are now on sale – AND are the BUY OF A LIFETIME!!!!!
!!! SUPPORT TRUMP !!! – GET YOUR tickets NOW !!!

CONSERVATIVES and all некультурный dolts
!*! REMAIN VIGILANT !*!
(or the bogyman will get you)
</SARC>


*********************************************************************************************

NOTE


The “Red”/”Blue”/”Green” color codes refer to the rates on this day of the week last week and are not NECESSARILY indicative of long term trends UNLESS associated with an average.
America’s performance against COVID-19 relative to the other “G-8+China” group remains consistently in the

“Hey! So we’re an NFL team and we tied the East Cupcake High School second string team.
It could have been worse.
sense that it has been all along.

22-10-06 A2 - COVID vs Other Causes TABLE.JPG
The US “New Cases per Day” graph looks encouraging, and so does the “14 days later” (it takes about that long for someone to die from COVID-19 if they catch it) ratio but the US “COVID Burden” still looks uncomfortably bad.

NONE of the “G-8+China” group of countries remains in the “Worst 25”.

However:
  • France at #27,
  • Germany at #30,
  • Italy at #34,
  • Japan #37, and
  • the US at #43,
(while out of the “Worst 25”) remain in the bottom quarter. Out of the bottom quarter, but still in the bottom third, is:
  • Russia #56,
Out of both the bottom quartile and bottom third are:
  • the UK at #80, and
  • Canada at #82,
(they are also doing better than the world average of #75).

(Sweden [NOT a G-8 country] is at #59 and is well back into the bottom third.)

The “Light At The End of the Tunnel” is that it appears that (except in the “ROAN” states) COVID-19 is running out of Trumpists to infect and kill.

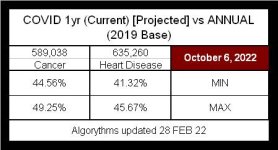
While COVID-19 is the THIRD (projected) cause of death this year in the US, the projected high rates are LESS than 49.3% of those for Cancer and 45.7.9% of those for Heart Disease.

22-10-06 A4 - CURRENT v 2019 ANNUAL.JPG
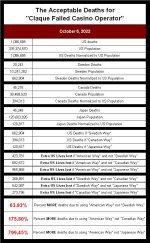
While it is true that if the US had followed “The Swedish Way” (which meant actually getting vaccinated – so THAT wasn’t going to happen) that would have saved around 423,781 (last Thursday it was 421,128) lives, so what the members of “Claque Failed Casino Operator” are actually saying is:

I’m OK with an additional 268,891 (last Thursday it was 269,648) MORE Americans dying by going the ‘Swedish Way’ instead of ‘The Canadian Way’.
[A total of an EXTRA 692,672 (last Thursday it was 690,776) deaths.]

and

I’m OK with an additional 542,087 (last Thursday it was 543,371) MORE Americans dying by going the ‘Swedish Way’ instead of ‘The Japanese Way’.
[A total of an EXTRA 965,868 (last Thursday it was 964,498) deaths.]

– BUT –

Them Kanookz, Japz an Sweedz are geddin vaxxuhnaded and I’M NOT GONNA DOODAT!

22-10-06 H2 - ACCEPTABLE DEATHS.JPG
 
* * * Page 2 * * *
The US REMAINS as the -second- WORST country in terms of the total number of “Active Cases”

22-10-06 F3 - WORST 54 ACTIVE CASES.JPG
HOWEVER, on the “brighter(?)” side,

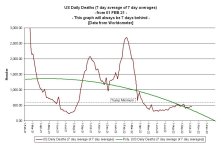
[1] the US 7 day average of 7 day averages for the number of “Daily Deaths” appears to have settled in to a “normal” state

22-10-06 B2b2 - 7 Day Average of 7 Day Averages BIDEN GRAPH.JPG
[2] while there has been no substantial change to the vaccination status of the several states.

22-10-06 J3 - STATE VAX RATES.JPG
Using the new metrics:
  • the “LOAN” states are 25.00% in the “RED” zone,
  • the “MOAN” states are 35.71 in the “RED” zone,
  • the “ROAN” states are 56.25% in the “RED” zone and, nationally,
  • the US is 41.18% in the “RED” zone.
[3] Although “The Red Team” met its “1,000,000 Dead by “April Fool’s Day” goal with lots of room to spare it is struggling to make its new goal of “1,250,000 Dead by ‘National Harvey Wallbanger Day’” (08 NOV)” but it looks like it will need a strong dose of divine intervention to make it (rather than some later date). Will it? Stay tuned and find out..

AND

[4] the US

(a) (Graded at D) is doing 0.0146% better than Latvia (but 0.0105% worse than Greece) and is the 16th worst country in the world with respect to “Deaths per Million”;

(b) (Graded at C- ) is doing a massive 0.0056% better than Bermuda (and only 0.0143% worse than Mongolia) with regard to “Cases per Million” and is the 58th worst country in the world on that metric – AND is OUT OF THE WORST QUARTILE.

<SARC>
So who says that the US healthcare system (“the world’s best healthcare system”) which is doing much better than the 57 countries that have a commie “universal healthcare system” that are doing worse than it is isn’t competitive with that of the other “powerhouse” nations?
</SARC>
(c) “Mortality Rate (ALL) is a mere 103.82% ([DOWN from last Thursday] of the Canadian one) which shows that (according to “Mashmontian Math”) the US is doing almost 2 times BETTER than Canada (because 103.82is closer to 200.00% than it is to 0.00%) and the fact that the Canadian “Covid Burden” is a mere 27.24% of the US (AND since so 103.82% + 27.24% = 131.07% that simply reinforces the fact that the US is doing ONE THIRD [{rounded to NO significant figures} verified by The University of Numberology] BETTER than Canada);

and

(d) number of daily deaths continues to (allowing for the cyclic pattern arising from the fact that a lot of people in a lot of states don't think that what happens on the weekends is worth bothering to report as it happens) appear to be improving.
– FULLER REPORTS ON SATURDAYS –
 
Today's
QUIK-EE-REVU®

FRIDAY 07 OCT 22

<SARC>
WELCOME TO McCOVID’s – OVER 98,000,000 SERVED
The McCOVID’s "BIG XCIX" contest tickets ARE ALMOST HALF GONE!!!
Buy one for yourself and get another for your family for FREE.
!!! SUPPORT **P*R*E*S*I*D*E*N*T** TRUMP !!!
!!! GET YOUR tickets NOW !!!

CONSERVATIVES and all некультурный dolts
!*! REMAIN VIGILANT !*!
(or the bogyman will get you)
</SARC>


*********************************************************************************************

NOTE


The “Red”/”Blue”/”Green” color codes refer to the rates on this day of the week last week and are not NECESSARILY indicative of long term trends UNLESS associated with an average.
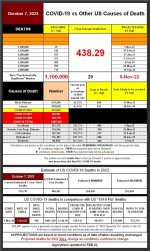
America’s performance against COVID-19 relative to the other “G-8+China” group remains as “efficient” (as the Red Army’s general staff’s conduct of WWII was) as it has been all along.

22-10-07 A2 - COVID vs Other Causes TABLE.JPG
There has been SOME change to the vaccination status of the several state groups as:
  • the “LOAN” states are 47.50% [⇑] in the “GREEN” zone,
  • the “MOAN” states are 7.14% [~] in the “GREEN” zone,
  • the “ROAN” states are 0.00% [~] in the “GREEN”[/B][/COLOR] zone, and
  • the US (as a whole) is 19.61% [⇑] in the “GREEN”zone.
The seven day average deaths appear to have crested and to be inching downwards.

The US “New Cases per Day” and the "14 days later” graphs continue to look encouraging.

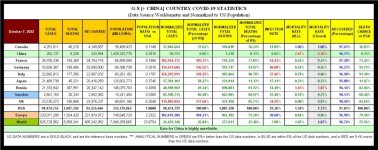
When you look at the normalized results for the “G-8+China” group, an aggregated Europe, and an aggregated World

22-10-07 A5 - G8+CHINA NORMALIZED.JPG
things don’t look any better.

And, the US is still the worst performing country in terms of “Total Cases”.

22-10-07 F1 - WORST 54 TOTAL CASES.JPG
It has 7.17% of the total population of the WORST Quartile countries and has 16.61% of the cases. That means that the US earns a D- letter grade.

NONE of the “G-8+China” group of countries remains in the “Worst 25” for “COVID-19 Burden”.

However:
  • Germany at #27,
  • France at #28,
  • Italy at #35,
  • Japan at #36, and
  • the US at #45,
while out of the “Worst 25”, still remain in the worst quartile.

Out of the worst quartile, BUT still in the worst third, are:
  • Russia at #57, and
  • the UK at #62,
Out of the worst third AND doing better than the world average of #75 is:
  • Canada at #86.
That, as usual, ignores China’s mostly mythical numbers which (were they believable) would place it at #199.

Sweden [NOT a G-8 country], is at #59, is into the bottom third and is heading for the bottom quarter.

NOTE – Those are RELATIVE ratings and, as evidenced by the declining mortality rates, the ACTUAL burdens are highly likely to be falling.
 
* * * Page 2 * * *
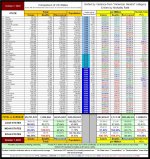
A general overview of the situation regarding “ROAN”, “MOAN”, and “LOAN” states is

22-10-07 D0 - RED v BLUE TABLE.JPG
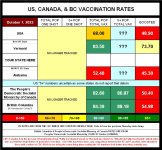
Or you might want to take your state’s data from the above and see how you are doing against the rest of the US and the Northern Commie Menace by putting it into this

22-10-07 J5 - US-CAN-BC VAX RATES.JPG
table. The US is increasing the rate that its people have been “boosted” at 76.92% of the Canadian rate (and 51.46% of the BC rate).

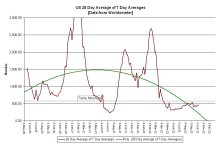
The “Light At The End of the Tunnel” is that, while it appears that COVID-19 is running out of Trumpists to infect and kill, the impact of COVID-19 appears to have leveled off into its “normal” rate.

22-10-07 C2b - US 28 Day avg of 7 d.a. GRAPH.JPG
However, there is a possibility that what we are seeing now is that the effects of COVID-19 are settling in to a “historical norm”. We’ll just have to wait and see.

If the US had followed “The Swedish Way” (which meant actually getting vaccinated – so THAT wasn’t going to happen) that would have saved around 424,447 (last Friday it was 421,602) lives, so what the members of “Claque Failed Casino Operator” are actually saying is:

I’m OK with an additional 268,894 (last Friday it was 269,652) MORE Americans dying by going the ‘Swedish Way’ instead of ‘The Canadian Way’.
A total of an EXTRA 693,340 DEATHS (last Friday it was 691,253).

AND

I’m OK with an additional 541,889 (last Friday it was 543,083) MORE Americans dying
by going the ‘Swedish Way’ instead of ‘The Japanese Way’.
A total of an EXTRA 966,336 DEATHS (last Friday it was 961,253).

– BUT –

Them Kanookz, Japz an Sweedz are geddin vaxxuhnaded and I’M NOT GONNA DOODAT.”
AND, on the “brighter(?)” side,

[1] “The Red Team” says that its goal is (as it has always been) “1,250,000 DEAD BY National Harvey Wallbanger Day(08 NOV)” (but the wise might consider “a slightly later date” to be a safer bet).

AND

[2] the US

(a) (Graded at D) is doing 0.0146% better than Latvia (but 0.0115% worse than Greece) and is ONLY the 16th worst country in the world with respect to “Deaths per Million”;

(b) (Graded at C-) is doing a massive 0.0050% better than Bermuda (and only 0.0148% worse than Mongolia) with regard to “Cases per Million”, is the 58th worst country in the world on that metric, and remains (safely?) out of the bottom quartile.

<SARC>
So who says that the US healthcare system (“the world’s best healthcare system”) which is doing much better than the 57 countries that have a commie “universal healthcare system” that are doing worse than it is isn’t competitive with that of the other “powerhouse” nations?)
</SARC>
(c) “Mortality Rate (ALL) is a mere 103.82% (DOWN from last Friday] of the Canadian one) which shows that (according to “Mashmontian Math”) the US is doing almost 2 times BETTER than Canada (because 103.82% is closer to 200.00% than it is to 0.00%) and when you add in (as the people at The University of Numberology do) the fact that the Canadian “Covid-19 Burden” is 26.46% of the US one, you realize that the US is doing almost ONE THIRD BETTER than the socialist dictatorship that committed the 8/20 terrorist attack on Washington DC;

(d) number of daily deaths continues to (allowing for the cyclic pattern arising from the fact that a lot of people in a lot of states don't think that what happens on the weekends is worth bothering to report as it happens) appear to be improving;

and

(e) it appears that the COVID-19 “situation” has settled into a “New Normal” and that the daily deaths/cases are going to be fluttering around 400 (with the same sort of seasonal variation as “The Flu” has) – at least until

(i) the gene pool gets thinned out a bit,

(ii) someone tosses megabucks at pharmaceutical companies, or

(iii) both.
– FULLER REPORTS ON SATURDAYS –
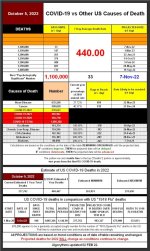
 
The situation with COVID-19 in the US has now stabilized to the point where deaths from COVID-19 are consistently falling within the ±5% range of the deaths from accidents.

That being the case, I will no longer be providing daily updates.

I'll consider posting weekly (on Fridays, since that's the day that I get access to the CDC numbers AND since Fridays appear to be one of the more representative days [Thursday {when the Wednesday data becomes available and the previous weekend backlpg has been cleared off}

However, I will continue to monitor AND, if the situation changes (outside of what I consider to be "seasonal fluctuation") I'll start posting more frequently again.

For those of you who have been following this thread, thanks for your loyalty and patience.
 
Back
Top Bottom