• This is a political forum that is non-biased/non-partisan and treats every person's position on topics equally. This debate forum is not aligned to any political party. In today's politics, many ideas are split between and even within all the political parties. Often we find ourselves agreeing on one platform but some topics break our mold. We are here to discuss them in a civil political debate. If this is your first visit to our political forums, be sure to check out the RULES. Registering for debate politics is necessary before posting. Register today to participate - it's free!

A Possible Explanation for the "Pause" in Global Warming

No, you said the following:
"No temperature data for the ocean before the Argo Array is worth the match it would take to burn it."
Post #101

"Any ocean temperatures prior to Argo is just a small step better than sheer conjecture."
Post #175

That is not what the bit you've selected says. Not even close, though I hardly expect you to acknowledge the falsehood of your anti-scientific rhetoric. A couple of paragraphs after your selected section, we read:
"Basically, the data diminish in number with increasing depth. In the upper ocean, the all-data annual mean distributions are quite reasonable for defining large-scale features, but for the seasonal periods, the data base is inadequate in some regions. With respect to the deep ocean, in some areas the distribution of observations may be adequate for some diagnostic computations but inadequate for other purposes."

The upper ocean data shows a vastly different trend, of course :roll:


Well you sure ain't that bright, I'll give you that. A four-year snippet of data from a tiny region of the Pacific Ocean cannot possibly provide statistically significant information about longterm trends of global ocean temperatures.

I shouldn't be surprised you're finding this difficult, considering you earlier read "Politicians are honest" when I wrote "Politicians want votes" :roll:

If you're really this confused, we can revisit Post #178:
> I asked you the source for your claim that "Recently the Argo Array of buoys showed that the ocean warming... was not occurring"
> Instead of telling me your source, you apparently "just clicked around" on the Argo site until you found a page with two time/temperature graphs, and selected one of them to post
> To illustrate how utterly abysmal the kind of stuff you considered 'evidence' for your claim was, I showed how different the other graph was and posted a map with regions they represent (Nin0 3.4 and the red dot):


And of course you still haven't answered my original question. What was your source for that claim? Did you even have a source for it?

Did you have any reason at all to declare that "Recently the Argo Array of buoys showed that the ocean warming they were claiming with certainty was occurring was not occurring"?

Is there some reliable information you have tactically kept hidden all this time?
Did you simply decide to make it up, then "just clicked around" in the hopes of finding something to fool us?
Or did one of your trusted sources deceive you? :doh


The graph in figure 1 is captioned with this phrase:

"GLOBAL

The Global OHC data through December 2010 is shown in Figure 1. It continues to be remarkably flat, considering the rise that took place during the 1980s and 1990s."


Climate Observations: October to December 2010 NODC Ocean Heat Content (0-700Meters) Update and Comments


Take a break from your raving and do a little light reading.
 
The graph in figure 1 is captioned with this phrase:

"GLOBAL
The Global OHC data through December 2010 is shown in Figure 1. It continues to be remarkably flat, considering the rise that took place during the 1980s and 1990s."

Climate Observations: October to December 2010 NODC Ocean Heat Content (0-700Meters) Update and Comments

Take a break from your raving and do a little light reading.
That is actually a proper source and graph! :eek:

But I can safely assume that you would have posted that originally, if that had been the reason for your original claim, yes?
If so, I still have to wonder what originally prompted your claim. But I guess it doesn't really matter.

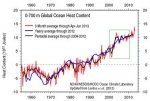
Bob Tisdale's graph appears to be of the 3-month averages ("...no other major changes with the latest 3 months..."), but obviously only goes up to the end of 2010 ("This update includes the data through the quarter of October to December 2010"). Fortunately - though you may have unaccountably missed it (again!) - I have numerous times provided you with the link to the page where you can find more up-to-date information. In fact the exact same information as shown in Tisdale's graph, albeit more up-to-date, should have been the very first graph you saw every time you checked my source. Isn't that a happy coincidence?

I've highlighted in green the last section visible in Bob Tisdale's graph to late 2010; in the red 3-month plot you can see the big low after 2000, the peak shortly after that, then three smaller peaks and 3-4 troughs. It's a bit bigger and clearer on the original page. I think I've seen his name in some other pages, and I gather that Tisdale is a bit of an AGW sceptic, isn't he? But even he was not foolish enough to say that "the Argo Array of buoys showed that the ocean warming... was not occurring," as you did, because the half-decade snippet he was commenting on (which, on average, was still increasing slightly) is not quite enough to prove something like that.

The more up-to-date graph illustrates very nicely that contrary to your claim the warming has not stopped, don't you think?
NOAA3.jpg

And, as you can see on the third graph of the page, the warming trend is even stronger at 0-2000 meters.
 
That is actually a proper source and graph! :eek:

But I can safely assume that you would have posted that originally, if that had been the reason for your original claim, yes?
If so, I still have to wonder what originally prompted your claim. But I guess it doesn't really matter.

Bob Tisdale's graph appears to be of the 3-month averages ("...no other major changes with the latest 3 months..."), but obviously only goes up to the end of 2010 ("This update includes the data through the quarter of October to December 2010"). Fortunately - though you may have unaccountably missed it (again!) - I have numerous times provided you with the link to the page where you can find more up-to-date information. In fact the exact same information as shown in Tisdale's graph, albeit more up-to-date, should have been the very first graph you saw every time you checked my source. Isn't that a happy coincidence?

I've highlighted in green the last section visible in Bob Tisdale's graph to late 2010; in the red 3-month plot you can see the big low after 2000, the peak shortly after that, then three smaller peaks and 3-4 troughs. It's a bit bigger and clearer on the original page. I think I've seen his name in some other pages, and I gather that Tisdale is a bit of an AGW sceptic, isn't he? But even he was not foolish enough to say that "the Argo Array of buoys showed that the ocean warming... was not occurring," as you did, because the half-decade snippet he was commenting on (which, on average, was still increasing slightly) is not quite enough to prove something like that.

The more up-to-date graph illustrates very nicely that contrary to your claim the warming has not stopped, don't you think?
View attachment 67155472

And, as you can see on the third graph of the page, the warming trend is even stronger at 0-2000 meters.


And the graph in question.

For some reason I couldn't get it to load yesterday. It has only an short term, but it's only missing the last 3 or so years.

jrsoc3.jpg
 
Back
Top Bottom