• This is a political forum that is non-biased/non-partisan and treats every person's position on topics equally. This debate forum is not aligned to any political party. In today's politics, many ideas are split between and even within all the political parties. Often we find ourselves agreeing on one platform but some topics break our mold. We are here to discuss them in a civil political debate. If this is your first visit to our political forums, be sure to check out the RULES. Registering for debate politics is necessary before posting. Register today to participate - it's free!

2013 spending, budget, and monetary policy discussion

Sort of. So long as we can keep growth in GDP ahead of growth in Debt, we are good.


Wholeheartedly agreed. I'm so happy to see you join the coalition to remove money from the directing hands of politicians, who allocate it according to political incentives rather than incentives related to productivity, and back into the hands of the market, which allocates it according to precisely the formula you propose.

We are somewhat on the same page!!! I work for a flooring company and most of the big jobs are public works (school, va hospital). This kind of spending is the kind that sparks economic growth it creates literally hundreds of jobs, and it actually goes to good cause (new school, better hospital for veterans). Without these jobs during the recession, I wouldn't have a job! This is the kind of direct stimulus we need, partner this with smart tax cuts and GDP growth will be ahead of debt in the long run.

I really wish we could audit every single program and reallocate these wastes in smart spending, I know this seems too big to even approach but everyone could get on board. As a progressive I do believe that stimulus spending is necessary to reboot the economy, but as you said we need money back in the hands of the market so the flame can continue to burn (powerful analogy, isn't that convincing? lol).
 
We are somewhat on the same page!!! I work for a flooring company and most of the big jobs are public works (school, va hospital). This kind of spending is the kind that sparks economic growth it creates literally hundreds of jobs, and it actually goes to good cause (new school, better hospital for veterans). Without these jobs during the recession, I wouldn't have a job! This is the kind of direct stimulus we need, partner this with smart tax cuts and GDP growth will be ahead of debt in the long run.

:) Sort of. There are things that government can do to encourage economic activity; but that list is short. "More schools" does not equal "Better Education System". We have built lots of schools and added lots of teachers in the race to get our student-to-teacher ratio as low as possible over the last couple of decades, with little or no results to show for it. So while I agree it "creates" lots of jobs in the immediate, visual sense, we also need to ask ourselves how many jobs were stillborn because the funds were not used to do other, potentially more productive things instead.

I really wish we could audit every single program and reallocate these wastes in smart spending, I know this seems too big to even approach but everyone could get on board. As a progressive I do believe that stimulus spending is necessary to reboot the economy, but as you said we need money back in the hands of the market so the flame can continue to burn (powerful analogy, isn't that convincing? lol).

:) As a realist, I have to note that none of those keynesian studies showing a multiplier effect ever do a cost-benefit analysis for what the money would have been doing otherwise; and are hence rather suspect. If you take $10 from someone and then give them $8; you haven't made them 8 bucks richer, you've made them 2 bucks poorer.
 
Last edited:
Since it is an annual number I would say that main important thing would be to ensure the same standard is equally applied. However, I would say real is your better measurement over time. If the deficit is 1% of GDP but growth is 3% of GDP, that's sustainable. If the deficit is 5% of GDP and growth is 1.8%; that is not.

It was kind of a trick question. If using real GDP growth, you would need to also discount the present value of stock debt to reflect changes in purchasing power relative to a fixed payment stream. However, it will not change the outcome and so all that is ever measured is the growth rate in nominal terms relative to stock and flow of federal debt.

No one ever said that the private sector was perfectly efficient.

Agreed. Why did you respond as though i did?
 
As a realist, I have to note that none of those keynesian studies showing a multiplier effect ever do a cost-benefit analysis for what the money would have been doing otherwise; and are hence rather suspect. If you take $10 from someone and then give them $8; you haven't made them 8 bucks richer, you've made them 2 bucks poorer.

Two charts: one depicting the actual amount of gross saving and the other depicting the amount of gross savings assuming a balanced budget. Both are factored for inflation.

Actual

fredgraph.png


Balanced budget

fredgraph.png


Now when we consider change in savings on an annual basis, something interesting occurs. There is a negative correlation between the growth in total savings, and the GDP growth. You are welcome to import the data into excel and perform your own regression analysis.

fredgraph.png


Why? Because the U.S. is a consumer based economy.
 
It was kind of a trick question.

It did seem weird.

If using real GDP growth, you would need to also discount the present value of stock debt to reflect changes in purchasing power relative to a fixed payment stream.

That is a worthy point, also worthy would be that with a very few exceptions in time, the interest rates tied to that debt remain higher than inflation.

However, it will not change the outcome and so all that is ever measured is the growth rate in nominal terms relative to stock and flow of federal debt.

again, so long as the same measure is applied to both - you can continually add on debt so long as you add on less than you grow.


Agreed. Why did you respond as though i did?

:shrug: that was not the intent - I was explaining my own position; that I recognize the market will allocate resources in ineffective ways, and only point out that it will allocate resources more productively than government, due to the difference in incentives.
 
Two charts: one depicting the actual amount of gross saving and the other depicting the amount of gross savings assuming a balanced budget. Both are factored for inflation.

Firstly, you have not actually answered the question - though if you can provide an example of a keynesian multiplier effect calculation that takes into effect the loss of the activity that the same money would have otherwise been performing, let me know; I would very much like to see it.

Secondly, you are going to have to tease out the specifics of this for me. A) when you are speaking of gross savings, what all are you putting into that measurement and B) what assumptions are you inputting to your balanced budget measure.

Now when we consider change in savings on an annual basis, something interesting occurs. There is a negative correlation between the growth in total savings, and the GDP growth. You are welcome to import the data into excel and perform your own regression analysis.

Why? Because the U.S. is a consumer based economy.

I think this is a short term-focused misrepresentation of what savings is and what is occuring during those time periods - naturally during times of downturns we see increases in savings as people attempt to pay down debt that has gone bad and there is greater incentive to protect ones'self against (now more likely) negative economic events effecting them personally. Furthermore, savings is nothing less than current investment and future consumption. You cannot consume yourself rich for the same reason that you cannot eat yourself a crop of corn - production precedes consumption.


I understand that you are attempting to argue that without government stimulus spending the same funds would be dedicated solely to savings, which you claim has a negative economic impact. The problem with that is that both of those assumptions are (I believe), untrue.

Firstly, the money that does flow to savings (and much of it will) will recap a broke banking system, encouraging the actual future growth of lending activity. The Fed's actions seem to have mostly resulted in the banks increasing their deposits at the fed in order to fix their balance sheets - hardly the economic activity that we wanted them engaging in, though at least they are repaired. However, savings produces return in the form of interest rates which (as you more than well know) move inversely to demand for the savings vehicle. As more money pours into money markets, the return lowers until money gets' put into riskier assets. The same occurs in the bond market - but if money is sucked out of market allocation in order to spend on politicians favorite constituencies at the same time that we dramatically increase the supply of lowest-risk securities.... then the ability of reduced return to push reduced funds upward the risk/return scale is retarded, and we see precisely the low-growth that you highlight.

Secondly, as stated, savings do not have a net economic impact, but rather a positive one since at the very least the represent future consumption married to current low-risk investment (in such vehicles as savings accounts, part of which then become people's houses, small businesses, etc), and at the best represent current investment in production.

This is another flaw of Keynesianism. Not only does it fail to account that it's spending has to come from somewhere, it is incredibly short-sighted. Don't plan for the future for in the future we'll all be dead isn't exactly a good formula for long-term planning.
 
Last edited:
Firstly, you have not actually answered the question - though if you can provide an example of a keynesian multiplier effect calculation that takes into effect the loss of the activity that the same money would have otherwise been performing, let me know; I would very much like to see it.

You are heroically assuming "the same money" would have been invested otherwise. This is surely not the case. That is another aspect of the paradox of thrift; savings increases are not offset by gains in investment. Or better yet, can you provide even a limited amount of data analysis that supports the notion that private investment increases when private savings increases?

This nonsense about measuring the opportunity cost of inducing a multiplier effect through fiscal stimulus is a strawman.

Secondly, you are going to have to tease out the specifics of this for me. A) when you are speaking of gross savings, what all are you putting into that measurement and B) what assumptions are you inputting to your balanced budget measure.

Gross savings is gross savings: government + private - (foreign). In the case where "foreign" is positive, it represents outflow of investment, i.e. the amount of money invested abroad minus the amount of money invested from abroad is positive. By subtracting gross government savings (which is negative) from private - foreign savings, it reduces their respective contribution to plug the government shortfall. Please keep in mind that the savings = investment identity for NIPA is exactly that! My point is that there is a strong correlation between increases in gross saving and declines in economic growth. This should be a matter of intuition; consumption is 69% of the economy.

If it magically worked out that we could spend less, save more, and grow from a total productive standpoint.... we would be a net exporting economy.

I think this is a short term-focused misrepresentation of what savings is and what is occuring during those time periods - naturally during times of downturns we see increases in savings as people attempt to pay down debt that has gone bad and there is greater incentive to protect ones'self against (now more likely) negative economic events effecting them personally. Furthermore, savings is nothing less than current investment and future consumption. You cannot consume yourself rich for the same reason that you cannot eat yourself a crop of corn - production precedes consumption.

High levels of consumption are a function of wealth. People with higher incomes consume more than people with lower incomes, ceteris paribus. Saving reduces economic activity. As we can see today, the willingness to invest is predicated on the confidence to drive sales. America had to endure the equivalent of 8 months working for free in order to regain the losses of net wealth. Increases in the savings rate or general gains in savings are only beneficial to the economy when they occur during periods of economic growth.

I understand that you are attempting to argue that without government stimulus spending the same funds would be dedicated solely to savings, which you claim has a negative economic impact. The problem with that is that both of those assumptions are (I believe), untrue.

No, i am saying there is not a 1:1 relationship between changes in gross savings and changes in gross private domestic investment. Do keep in mind that in the savings = investment identity, there is a component known as gross government investment.

Firstly, the money that does flow to savings (and much of it will) will recap a broke banking system, encouraging the actual future growth of lending activity. The Fed's actions seem to have mostly resulted in the banks increasing their deposits at the fed in order to fix their balance sheets - hardly the economic activity that we wanted them engaging in, though at least they are repaired. However, savings produces return in the form of interest rates which (as you more than well know) move inversely to demand for the savings vehicle.

First and foremost, you are saying that deposits are different than reserves. In reality, reserves are a subset of deposits. That the banking system has more excess reserves than in any time in history has recapped a broke banking system. Banks earn money on the spread between the cost of short duration deposits (an outflow) and long duration loans (an inflow).

As more money pours into money markets, the return lowers until money gets' put into riskier assets.

That can be a long time. The rate of return reflects the level of risk adversity.

The same occurs in the bond market - but if money is sucked out of market allocation in order to spend on politicians favorite constituencies at the same time that we dramatically increase the supply of lowest-risk securities....

If deficits increase when investment is increasing, this is a problem. However, we have witnessed the exact opposite from an empirical standpoint. Gross private domestic investment fell due to the fear that total return would be less than initial investment. And now, it is regaining steam as the consumer continues to repair their balance sheet and net wealth (in real terms) approaches post crisis levels.

then the ability of reduced return to push reduced funds upward the risk/return scale is retarded, and we see precisely the low-growth that you highlight.

Low growth is the result of a financial recession that set the country back more than 5 years.

Secondly, as stated, savings do not have a net economic impact, but rather a positive one since at the very least the represent future consumption married to current low-risk investment (in such vehicles as savings accounts, part of which then become people's houses, small businesses, etc), and at the best represent current investment in production.

I am not saying that saving is bad. Saving is good. It's the motivation behind savings that matters. If everyone begins saving more money because they are afraid, that is bad.

This is another flaw of Keynesianism. Not only does it fail to account that it's spending has to come from somewhere, it is incredibly short-sighted. Don't plan for the future for in the future we'll all be dead isn't exactly a good formula for long-term planning.

Pick a better strawman.
 
:) Sort of. There are things that government can do to encourage economic activity; but that list is short. "More schools" does not equal "Better Education System". We have built lots of schools and added lots of teachers in the race to get our student-to-teacher ratio as low as possible over the last couple of decades, with little or no results to show for it. So while I agree it "creates" lots of jobs in the immediate, visual sense, we also need to ask ourselves how many jobs were stillborn because the funds were not used to do other, potentially more productive things instead.

I agree with you my point was a very basic one, but you get the idea of it, Government spending can be used in more productive ways.
 
As long as we can keep inflation down
then the debt isn't the main issue. If we were spending money in more productive ways (Infrastructure, insert idea here) then we should be seeing some faster growth and even faster debt reduction. The increase in employment should come before inflation begins and debt is a huge issue. I really think too many are hesitant to invest because no one knows how we are going to approach this. Congress is so unpredictable and dysfunctional that not many are confidant enough to start rebuilding our economy. But of course they can put all that Fed money in the stock market and watch it boom. We really should be increasing capital gains rates so maybe we will start investing in america, and making a corporate rate that is actually progressive and lower. I'm against raising all other tax rates, we need to keep picking up steam, I'm really surprised more Democrats arn't against them to... Now is not the time for austerity, now is the time for growth. Big spending cuts will only hurt the trend too, but even a liberal can agree there is a lot bs spending around!

There is a lot of "should'" in your predictions, none of which are based on any objective evidence or data.

According to the liberal democrats we should by now have a growth rate large enough to offset the cost of ObamaCare.....

And inflation being as low as it is is a good indicator for you ?

It just means our economy sucks, and trillions in new money is stagnant and parked at banks.

Sorry, but we've been listening to the lies out of the Obama administration since day one, which includes all of the money that was supposed to be spent on " infrastructure" in Obama's stimulus.

You guys dont have much credibillity left.
 
I present to charts; one is the budget deficit since Obama's time in office, and the other is the official budget deficit established by congress. Since the 2013 data is incomplete, i used a simple geometric mean of previous data to fill in the rest of the year. All data used can be found here.

View attachment 67152023

So what does it tell us? The budget deficit that can be attributable to the Obama administration (yearly) is likely to decrease by 51% in 2013. During his presidency, the budget deficit will have declined by 65%. The official U.S. budget deficit is likely to come in at $686 billion, a 35% decrease from the year prior.

A bell should be ringing for the more astute members here. Since January 2013, the Federal Reserve has purchased about $359 billion in Treasury securities, while the debt specific supply of Treasury securities since January 2013 is $315.3 billion, meaning the Federal reserve is facing a whole new dilemma. They are losing their ability to control long term interest rates, given their current policy tools. As the Fed's demand for USTS's continues to exceed debt specific supply on a consistent basis, two things can occur. First, a dual pricing mechanism can emerge with respect to the Maiden Lane transactions and the rest of the secondary Treasury market. Primary dealers are fully aware that the Fed's purchasing program is likely to exceed the net debt issuance of the U.S. Treasury. Durations that receive the least targeting of Fed purchases (longer dated securities) will have a downward pressure in prices as secondary dealers crowd into where the Fed action is most aggressive. Which creates the need of a future twist program to smooth out the yield curve (point 2).

One thing is certain. The notion of a U.S. debt crisis has been completely overblown.

The data on asset purchases can be found here.

barackazillion.jpg

I bet you a Barackazillion dollars that inflation is a conspiracy theory.
 
The Debt is a bipartisan problem that is the result of the right's lowering of tax rates on the upper bracket and the lefts refusal to cut spending for social programs. It was dumb to assume that simply lowering taxes on the upper brackets would somehow spur economic growth; on the contrary, just because someone is making more money doesn't mean they will necessarily use that money the way it is needed. However, the government is incapable of effectively using the money in a pro-growth way either--no one is due to the spontaneity of our free market economy, and any argument on the contrary is just sophistry intended to delay the inevitable.

The wars also contributed to the problem; back in the good ol' days, when one country beat another, there was a thing called reparations to counteract the cost of going to war. But, nowadays, instead of the losing country paying reparations, it seems like the winning country pays reparations, especially in these middle-east countries.
 
Last edited:
The Debt is a bipartisan problem that is the result of the right's lowering of tax rates on the upper bracket and the lefts refusal to cut spending for social programs. It was dumb to assume that simply lowering taxes on the upper brackets would somehow spur economic growth; on the contrary, just because someone is making more money doesn't mean they will necessarily use that money the way it is needed. However, the government is incapable of effectively using the money in a pro-growth way either--no one is due to the spontaneity of our free market economy, and any argument on the contrary is just sophistry intended to delay the inevitable.

The wars also contributed to the problem; back in the good ol' days, when one country beat another, there was a thing called reparations to counteract the cost of going to war. But, nowadays, instead of the losing country paying reparations, it seems like the winning country pays reparations, especially in these middle-east countries.

Wow! The search for intelligent life on DP has been successful.

Thank you for posting your well articulated thoughts rather than restatements of what you heard last night on a left or right wing talk show.

To other posters, intelligent debate begins when you step away from party talking points to concede the bi-partisan fault for where we are today and the existence of some decent ideas on the other side of the aisle....
 
I but you a Barackazillion dollars that you believe inflation is an increase in the money supply.

Lol good one, but I was actually making a joke because I was annoyed at some of the vacuous posts on this thread. :)
 
The Feds want to taper off QE, but if it impacts elections in 2014 negatively for the powers that be it will be reinstated to keep the sheep on board.
 
Lol good one, but I was actually making a joke because I was annoyed at some of the vacuous posts on this thread. :)

My apologies, i was assuming you were of... Austrian influence.
 
I follow some Austrian principles but not all. What school of economics would you identify yourself with?

I prefer a multi-school approach. However, i have been most interested as of late in behavioral economics as well as institutionalism.
 
Simple solution, spend less than you get. If you have to borrow to pay for it, don't do it unless it's war or a national emergency.
 
Simple solution, spend less than you get. If you have to borrow to pay for it, don't do it unless it's war or a national emergency.

How do you know how much you get? For example, what if a severe economic downturn occurs which results in a 25% reduction in federal receipts?
 
How do you know how much you get? For example, what if a severe economic downturn occurs which results in a 25% reduction in federal receipts?

One way to do it is to look at long term growth rates, for example in the U.S. 2-3% may be realistic. Assume that over time we will reach those levels and budget accordingly.

In downturns you would expect to raise spending while revenues are down to pick up some of the slack, and then back off when the economy has gotten it's "legs" back.

Also remember that we don't only have to rely on fiscal policy as we have the Fed with their mandate on the monetary side.
 
Great topic Kush! Always encouraging to see some serious discussion around the topics that truly matter. The conversation seems to have gone down the road of the debt, deficit, and the economy (all great points I'd like to comment on) but it seems your original post was touching on a bit more esoteric topic -- given the shrinking deficit is the Fed approaching a limit on the number of treasuries it can buy without disrupting the market? It's a fascinating topic and one that I've been particularly interested in since the first rumors of QE3 (or QE4EVA) began to surface. There was an old UBS research piece that zerohedge posted back in September of last year discussing the topic - albeit more related to the MBS market. The important bit is quoted below.

The Scary Math Behind The Mechanics Of QE3, And Why Bernanke's Hands May Be Tied | Zero Hedge

The bottom line, as calculated by UBS' Michael Schumacher and confirmed by anyone with access to the detail behind the Fed's SOMA holdings, which incidentally just hit a record 116 months two months ahead of Twist 2 schedule, is that "the Fed owns all but $650 billion of 10-30 year nominal Treasuries." Also as pointed out above, Twist 2, aka QE 3.5 is already absorbing all of the long end supply. And herein lies the rub. To quote UBS: "Taking out, say, $300 billion in long-end Treasuries almost certainly would put tremendous pressure on liquidity in that market....Ploughing ahead with a large, fixed size QE program could cause liquidity to tank."

Well, perhaps the Fed will just monetize MBS, as Bill Gross has been betting on for nearly a year now. It could do that... but when once factors in "math", the results are once again quite startling. Quote UBS again: The alternative of tilting purchases toward MBS implies that the QE program would need to be quite protracted. Monthly supply of conventional 15yr, 30yr and 30yr GNMA has averaged about $85-90 billion over the past year and the Fed is already buying about $25 billion. The Fed might be able to buy another $40 billion without disrupting the market. Assuming that the Fed does a $600 billion program with 75% in MBS, it would need to buy $450 billion in mortgages, so in our estimation the program would need to last nearly a year.

These predictions are old as they are speculation before the announcement, but they turned out to be a good predictor of what the program would look like and seem to foretell that the program could never be 4EVA as the Fed would start hitting a limit on their market share within a year. Keep in mind this is when deficit projections were much higher and naturally assumed net treasury issuance would provide more supply for the Fed to consume. Bernanke was obviously aware of these issues at the time, and arguably sized the new program perfectly -- a 40/45 split should keep them at a reasonable size of the MBS market and would give them enough runway in the Treasury market to allow them to meet their unemployment targets. Now I don't think Bernanke could have anticpated how sharp the contraction in the deficit has been, and may be timing the tapering due more to his worries about treasury (and repo, more on that below) market disruption than real economic data.

A more recent piece from FT Alphaville (best blog on the internet btw, you need to sign up but it's free and I highly recommend everyone to add it to their daily reading list) in May updated the issue with a piece from Nomura that came to the conclusion that the Fed has plenty of cushion before it reaches what it deems as the "danger zone", even if they decided to increase purhcases to $65bn:

The Fed can keep buying for a while, if it wants to | FT Alphaville

NomuraHoldings1-e1368474986404.png


The “danger zone” referenced in the chart above by Lewis Alexander of Nomura is a kind of arbitrary area between the Fed’s owning 50 per cent of the outstanding stock of Treasuries in a certain category (and thus potentially starting to affect market liquidity) and the 70 per cent threshold at which the SOMA desk will stop buying outright. As you can see, it will be a little while yet before the Fed approaches that threshold, even if it increases purchases to $65bn a month.

They point to the shrinking deficit as a significant drawback to the original research and even post an update at the bottom with the new CBO projections as being much lower than previously expected by the researchers.

It’s important to note one caveat, which is that since this note was released earlier this month, the outlook for the US fiscal situation has improved because of increased tax revenues and a surprisingly high forthcoming remit from Fannie Mae and Freddie Mac. Thus the overall stock of outstanding Treasuries will be somewhat lower than assumed above, though the impact likely won’t be so great as to change the dates by more than a few months.

UPDATE: The CBO announced Tuesday that it was cutting the projected deficit for the US in 2013 by nearly $200bn, and over ten years by $600bn. If the fiscal picture continues to improve, then it might have more of an influence on the outstanding stock of Treasuries than we had anticipated.

The other point they touch on which seems like a more serious concern is the shortage of safe assets in the collateral markets. (They also express outrage over the pace of fiscal contraction, a point I agree with and will touch on more below. In the end, this is how everything is interrelated -- the economy, financial markets, credit markets, debt, deficit, and monetary policy)

We’ve written in the past about other potential market disruptions from QE. Some of them — liquidity problems in auction markets, delivery fails — have failed to materialise, and seem unlikely to. But we still think QE does have a distorting effect on collateral markets. This is somewhat offset by the Fed’s paying of interest on reserves, which acts as a kind of sterilising safe asset for the dealers. It isn’t available to non-depositary institutions, though that may soon change.

We could well be wrong, but it’s hard for us to avoid the same conclusion we (and many, many others, including Ben Bernanke) have been reaching for several years now, which is that it remains an outrage for fiscal policy to have tightened so much so quickly.

There are nuances involved, of course, but looser fiscal conditions wouldn’t just help the economy recover more quickly; they would also help satisfy collateral requirements in lending markets and, by lifting rates up off the zero bound more quickly, render moot some of the debate over unconventional monetary policy and its relationship to financial stability.

The shortage of safe assets is a global phenomenon that has been written about extensively as central banks around the world push asset purchases to record levels at the same time that governments are rapidly shrinking their debt issuance. I'll be the first to admit it's an area that I'm not very familiar with, but a recent post by Scott Skyrim pointed out that in just the past two months, the overnight repo markets are reaching unprecendented (and dangerous) territory as the G.C. rate (the general collateral rate, i.e. what short-term repo lenders are willing to accept for high quality collateral) rapidly approaches zero, even flirting with negative rates intraday. It should come as no surprise that this acceleration occurred concomittant with the increasing reduction of net issuance that started in the spring. He notes that the remedy to this problem is limited: either the Fed ends QE, there is another major bond sellf-off, or the Fed begins to execute reverse repo operations with the Street in order to put good collateral back out in the market. Interestingly enough, there was a headline yesterday about a mention in the latest FOMC minutes about this exact thing (see second link below).

The QE repo distortion is uncharted territory for funding markets | FT Alphaville

Screen-Shot-2013-07-25-at-10.01.58.png


As he noted:

If the Fed continues QE buying for another 6 months at the current pace, can GC drop another 19 basis points? No, we’re just 5 basis points away from 0.0% right now. There’s little chance that GC rates will remain between .02% and .05% if the Fed continues to take securities out of the market, so it’s logical to assume GC will drop to 0.0% each day, like a heart monitor flat-lining on a dying patient. Even if the Fed pulls-back purchases and “tapers” later this year, it just means they’re purchasing less, and thus they continue to remove collateral from the market, albeit at a slower pace. There’s the potential that the QE purchases will create a major distortion in the Repo market, and at some point, something’s got to give. Market pressure to move below 0.0% will cause distortions in the Repo market. Though we could discuss some of the potential market distortions from GC at 0.0%, I believe it’s uncharted territory and there’s a significant risk building up in the funding markets.

So how do you stop the distortions?

Skyrm suggests three possible solutions:

  1. End the QE programs.
  2. Wait for another Debt Ceiling Crisis or major bond market sell-off to dump Treasury collateral back into the market. And as it turns out, the government could hit the Debt Ceiling again in November, or at least by the end of the year, so in one way, we have that to look forward to.
  3. The Fed could begin to execute “repo operations” with the Street. Formally called “Matched-Sales,” the Fed can intervene in the Repo market and put collateral back into the market. With GC rates close to 0.0% and having traded intra-day at negative rates many times over the past few months, I’m surprised the Fed has not executed any Repo operations to date. However, putting Treasury collateral back into the market after having removed it for QE could create market confusion. Perhaps traders might think it’s a tightening move – or even a signal of less easing? Perhaps the Fed is embarrassed to inject Treasurys back into market after having removed them for QE, it might signal that there’s a flaw in QE policy.

Will this be the ZLB/repo/collateral-scarcity solution we’ve been waiting for? | FT Alphaville

My takeaway from the points above (and to more directly address the OP) are:

  • The Fed was probably cognizant before the fact that the latest round of QE could never truly be open-ended, they were just praying that the deficit would stay elevated and unemployment would fall fast enough so that they could end the program before they ran into serious market problems
  • The more serious problem is not in the Fed becoming so large of player in the treasury market that they begin to effect liquidity -- the true problem is the effect on collateral markets and what the side effects are of a shortage of safe assets (is the 7 stdev. gold move in April a result of repo lenders reaching for good collateral? An interesting point explored here). Once overnight repo rates hit zero and begin to flirt with negative territory, there is significant risk for market distortions. The IOER helps support overnight interest rates in the interbank market, but the global shortage of safe assets has all sorts of interesting ramifications beyond just short-term funding markets (good read on it here)
  • The shrinking deficit not only has negative implications for the real economy, but ironically can also have serious effects on financial market stability. It leads me to question whether or not pure expectations-based monetary policy (which it seems consensus currently views as the most effective form of monetary policy in a liquidity trap) can be effectively implemented without cooperation from fiscal authorities. While I see all the merits of NGDPLT, I often wonder about how the actual mechanics of the market operations would work and whether or not it's possible to execute without either significant market distortions or the sacrifice of central bank independence. I'm sure Sumner has addressed this somewhere, but I haven't read a good answer to the question yet.

You are absolutely correct in your assessment of the "debt crisis". Conversely, the major risk posed to the economy and markets is a shrinking deficit. I briefly posted a few months ago about the effect of the deficit on corporate profits, and have written two short pieces on the debt and deficit for my company newsletter. Below is an edited down version of both, the first addressing the "debt" problem and the second talking about the effects of a shrinking deficit on corporate profits.

(continued below)
 
Debt Debate Rages On

Main Points
  • There is a fundamental misunderstanding not only about debt’s role in the economy, but also the current state of the federal debt and deficit.
  • Debt itself should not be ascribed any ethical connotations, as it is not inherently “good” or “bad”. Debt should be viewed in terms of usefulness, i.e. the use of it’s proceeds.
  • National governments are fundamentally different entities than private sector households or businesses, including their purpose of organization, role in the economy, and position in the capital markets.
  • The spending and debt of a national government plays a critical role in a country’s economic policy. Debt management needs to be in sync with the needs of the economy and society.
  • The recent uproar over the sustainability of the United States’ federal debt is largely misplaced; as evidenced by the strength of our currency and the reception of record treasury issuance by investors. There is no doubt in our minds that the U.S. has the ability and willingness to pay its debts.

In the Sunday NY Times Letters section on July 28th there was a series of letters debating the issue of debt levels in the US, whether they were dangerous or not and whether our outstanding debts needed to be repaid. The authors of the letters all had reasonable arguments for supporting their claims, probably feeling that they were at least somewhat “well informed” about the issues at hand. One of them had formerly worked at the Fed. However, as one might expect given the difficulty of addressing such a large set of issues in such a short space, there was little that the average reader could conclude about this issue based on the arguments being made. The purpose of this piece was to comment on the points raised in the article.

Utility of Debt
Debt is neither inherently good nor bad; absolute levels of debt are not inherently benign or frightening; and the purposes to which debt is used vary from critically necessary to frivolous. Government debt in particular is often discussed in ominous tones, with connotations of unprincipled profligacy. The most popular theme centers on trying to equate government spending to that of a household - comparing the debt racked up in Washington to that of a reckless shopper who maxes out their credit cards. While the sentiment behind this notion is perfectly understandable - if consumers are being forced to cut back, shouldn’t the government have to do the same – such an argument ignores the critical role federal debt plays in a capitalist society, from providing a foundation for risk in capital markets to replacing collapsed private borrowing during periods of economic slack and high unemployment (as well as providing for our defense, building our infrastructure and funding our social safety net).

Whether the borrower is a household, a business or the government, we generally regard the distinction between “good debt” and “bad debt” as whether the proceeds are used for needed (or superfluous) investment or consumption. When a new couple finances the purchase their first home, the use of debt allows them to make a productive investment in their future by building equity in an asset that will retain its value. When a company needs to increase manufacturing to keep up with growing customer demand, the use of debt allows them to make an investment in a new factory and grow their business. When a local city government needs money to build a new sewer system or bridge, debt facilitates them to make a productive investment in the city’s core infrastructure. These are all examples of debt being used for productive purposes. The contrary to this would be our previous example of a reckless shopper who maxes out their credit card, a business that uses debt to finance wasteful expenses, or a corrupt politician who uses debt to finance fancy dinners or expensive retreats.
Willingness and ability to pay: Looking at the letters from the NY Times we are struck by how much political rancor and hostility there apparently is surrounding debt levels in the United States. To defuse some of this anger, let’s try instead to look at our debt obligations from the perspective of a financial analyst trying to determine if the US is a good credit. You would only want to buy a bond where the borrower has the ability and willingness to pay back its debts. By this fundamental measure, our debt levels do not warrant concerns. Elements that go into this analysis include:

Three C’s of Credit
Character – While a more qualitative metric, the character of a borrower is a key consideration of lenders in fundamental credit analysis. While no person in their right mind would consider nearly any government on the planet as having “character”, there are certain corollaries that are worth mentioning. We believe one of the most important factors in sovereign debt sustainability is the stability of the country’s political, financial, and legal system. This is why historically one of the main causes of sovereign debt default in the past has been war. Countries with strong legal systems provide borrowers with proper recourse in the case of default, stable political systems allow for confidence that politicians will honor their obligations, and developed financial systems provide proper liquidity in the country’s currency and debt. The measure of the market’s perception of this character is most appropriately represented by the strength and status of their currency and credit default swaps on its debt. Two stark examples of the importance of character actually happened very recently, most famously in 2010 when Greece was found to be cooking their books by understating their true debt, and when the U.S. almost defaulted due to the debt ceiling negotiations in 2011. Both of these cases had significant ramifications for the bond markets and they both had very little to do with any traditional measure such as Debt/GDP.

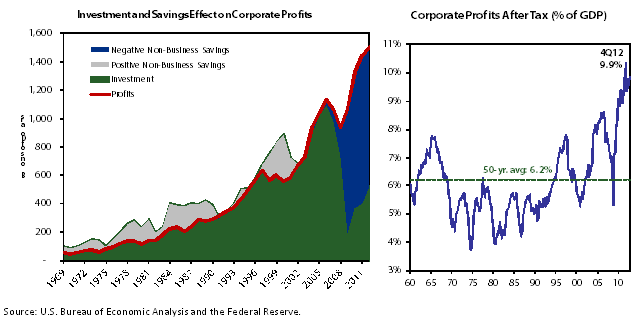
Capital/Collateral (Debt/GDP) – Another fundamental of investing in debt is determining the quality or adequacy of a borrower’s capital or productive assets relative to the borrower’s level of debts. Here too, we do not believe that current US debt levels warrant concern. US total Federal debt stands at about 104% of GDP. By comparison Japan has debt to GDP in excess of 240%, more than twice as high as the US. In neither of these two cases do markets appear to be concerned about these debt levels – again as measured by either the currency markets or credit default swap markets. Why not? Simple: because both countries are rich, with enormous pools of intellectual and productive capital. The US has $16.7 trillion in outstanding federal debts (marketable and non-marketable), but also has annual GDP of over $16 trillion and an estimated total household net worth of close to $69.3 trillion dollars (after subtracting out Treasuries).

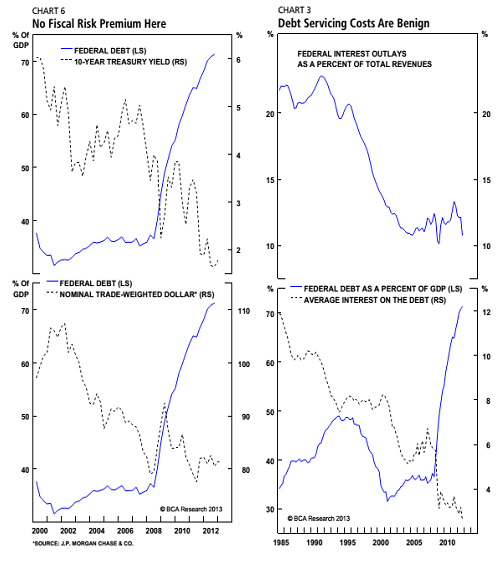
Capacity (Coverage, Interest Rates) – Perhaps one of the most important factors in credit analysis is the capacity of the borrower to honor their obligations. Measures of capacity primarily focus on the ability of the borrower to meet interest payments with ongoing cash flow. The capacity of a country to meet their obligations depends primarily on two factors. The first is the amount being spent on interest payments relative to various measures of wealth and cash flow. As the accompanying charts show, while the total amount of federal debt has clearly grown rapidly, our debt service costs as a percentage of the federal budget are at multi-decade lows - with federal interest charges as a portion of the Federal budget at 50% of their 1990 levels. Stated differently, our debt service cost in 2012 was $220 billion on a federal budget of $3.5 trillion or just 6% of outlays; and as a percentage of US GDP, debt service was a very small 1.3% of our $16.3 trillion in GDP . Simply put, given the size of our economy, we can handle our debts. Obviously as interest rates rise, the burden of this debt will increase (and we are not saying that debts should be allowed to grow without limit). But this is why it is so important to grow our economy; so that we will continue to have additional resources when they are needed.

The second, and probably most important, is the ability to print money. Technically, countries like the U.S. and Japan cannot be forced to default on their debt since their debt is all denominated in their own currency, of which they are the sole manufacturer. While the issue of debt monetization can jeopardize a country’s reputation (character) and may have other ill side-effects such as financial instability and inflation; the fact is that the U.S. government can never have a shortage of dollars needed to meet their obligations. This is another key area that makes analogies to Greece incorrect. One of the primary reasons for the runaway debt crisis in Greece was the government’s inability to print Euros, which disabled them from doing anything to contend with market forces. By all these current measures, we feel certain that the United States has the willingness and ability to meet its debts, and will continue to have that ability going forward given the current track of a growing economy and a rapidly shrinking budget deficit.

XWTAIdm.png


So do we need to borrow more or pay down our debts? The recent argument over debt has been simplified and exaggerated by both sides of the debate; with one side claiming that in the current environment that there is no limit on our ability to borrow, and the other side claiming that we are fast approaching a point of no return. In order to maintain a healthy and competitive economy over the long-term, debts cannot grow faster than incomes for very long periods of time . So there are limits. However, in the aftermath of the 2008 financial crisis there is still an abundance of idle resources that the private sector is unable to put to work; with banks afraid to lend, leaving households and businesses forced to curtail capital spending and investment. In this environment, interest rates have already been driven to zero by the Fed, so the only remaining lever that we have to promote growth is additional fiscal stimulus. The risk here is not that we have too much debt, but that we have too little activity. It is precisely in this environment where the economy is extremely sensitive to changes in fiscal policy. Here is where the federal government’s role is crucial – they can issue debt at very low interest rates (providing a place for people to invest their capital without fear of losing it) and invest it in both productive resources and consumption that not only creates jobs in the short-run but generates long-term benefits for the economy over the years to come. In fact, cutting back spending in attempt to reduce Debt/GDP has clearly already failed for the distressed countries of Europe (GIIPS) and we expect to see these policies changing before year’s end. In times of stress we need to continue to spend on productive endeavors, but we still need to spend on our defense as well as on our social safety net. The alternatives are too dire.

Conclusion: In hard times such as 2008, when the increase of federal debt was largely driven by a collapse in the private sector, the government was right to increase spending and cut taxes in an effort to make up for the shortfall in private sector investment and to make it easier for consumer who had seen a collapse in their incomes. The increases in US debt since then have been constantly criticized. While the maximum sustainable level of sovereign debt is impossible to quantify, our discussion above should give comfort that current levels are clearly sustainable. So where is the limit and how close are we to it? We believe that advanced countries, with sovereign monetary policy and floating exchange rate currencies are given long runways by the market. We don’t believe we are close to a point where the US would go bankrupt or see its debt markets disrupted, and we don’t believe that current levels of federal debt should be a primary concern in a period of low inflation, high unemployment and sluggish growth. We also don’t think we need to be focused on reducing our debt/GDP right now. Save that for the days when GDP growth is back above 5% and we’re at full employment (and then actually repay some of the debt). The debt issue is also less of an concern when the government is effectively borrowing at negative interest rates – as it is today for most of its borrowings. Borrowing at negative rates means that the government is profiting from its borrowings! It remains true that it is important to make sure the debt grows slower than our economy in the times that warrant it. Therefore, the extremes on both sides of the political debate are wrong; we believe that both the tax/regulate/anti-Fed crowd and the austerity/hard-money crowd are driven more by ideology than by proper economic policy. The focus of the debt debate should be on what the purpose of the debt creation is for, and what times are appropriate for the government to use debt as a tool for promoting a better society and a stronger economy.
 
Corporate Profits and the Deficit

One of the more interesting characteristics of the post crisis financial environment has been continued strong corporate profits - in spite of high unemployment and mediocre economic growth. The chart below illustrates this point, showing the recent divergence between rapidly rising earnings per share and slowly improving leading economic indicators . Corporate profits continue to set all-time highs and, at $1.5+ trillion in 2012 , currently remain almost 50% above their 2007 peak.

SZppNyK.png


So the question that we have to ask is: What has been the source of these profits? The answer turns out to be mostly the federal deficit. Generally speaking, profits are total revenue after subtracting total costs. Therefore, for the economy as a whole to earn a profit, there must be aggregate sources of revenue that are greater than their associated costs. In a normal, healthy economy this is primarily new capital investment – as companies invest in new equipment, buildings, etc. they capitalize the expense on their balance sheet while the seller recognizes the new sale as revenue. However, in a depressed economy, profits are primarily driven by deficit government spending. By spending more than it “earns” in taxes, the government creates revenue for businesses without those businesses incurring any additional costs. As the data on the next page demonstrates, this is why we’ve seen such a surge in corporate profits despite a struggling economy.

Conventional wisdom says that cost cutting, layoffs and increases in productivity account for these increased profits. While these factors can and do contribute to the profitability of individual corporations, they do not generate additions to profit for the economy as a whole since the cost savings or productivity gains from any one company correspond with lost revenue (and lower profits) for others. Known as The Fallacy of Composition, it is a mistake to assume that what is true for individual corporations is necessarily true for the economy as a whole.

The only two major sources of aggregate profits are net capital investment and negative savings by the non-business sector (governments, households and foreigners). Positive savings represent a negative for corporate profits since they essentially represent money that is not spent for consumption. Finally, we add dividends back into this equation, since dividends are effectively a source of income above wages and are not a “cost” on corporate income statements. Therefore, we can calculate corporate profits by subtracting non-business savings from new capital investment and adding back dividends. This leads us to the now famous economics equation that describes profits as follows:

Profits after taxes and dividends are equal to investment minus non-business savings, or
Profits = Investment + Dividends – Savings (Household + Government + Foreign)


Armed with this equation, we can get a better sense of what has been driving corporate profits over the past two decades. Since positive savings subtract from profits, we’ve switched the sign of the savings numbers below in order to illustrate each factor’s contribution to profits. For example, after this sign change, you can easily see the large contribution of government deficits to total profits in recent years. The following table of profits was internally generated with data from the Bureau of Economic Analysis at the US Department of Commerce:

KdTEObs.png


The data confirms what we described above: In a normal, healthy economy profits are driven by new investment while in a depressed economy, profits are supported by large government deficits. Going back to 1998, we see how this all fits together. During periods of strong economic growth, such as the late 1990s, profits were supported by net investment and a declining savings rate, while budget surpluses actually detracted from total corporate profits. Of course the opposite is true for the housing bust in the late 2000s; as net investment collapsed, personal saving spiked and government deficits soared to post-WWII highs. The persistence of high deficits over the past four years, as net investment has been slowly recovering, has allowed profits to reach all-time record highs, both in nominal terms and as a percent of GDP. The following chart summarizes this data back to 1969.

m5RNR7w.png


As the chart above on the left illustrates, net investments have been recovering since their lows in 2009. This trend is likely to continue over the intermediate term and provide a cushion to profits in the face of federal deficit cuts. The household sector continues to recover as a significant amount of consumer debt has been written off or paid down and housing prices have rebounded. Combined with the recovering housing market this should allow households to begin to borrow again, supporting both net investment and lower household savings rates. Furthermore, as corporate cash balances swell and borrowing costs remain low, more and more companies are buying back their own shares from investors. The growth of these buybacks over the past few years has been significant and provides an additional cushion for reported profits per share should total corporate profits decline. Nevertheless, our research shows that the impact of these buybacks is small relative to the impact of a significant decline in the deficit.

Ultimately, the key vulnerability for the corporate profits outlook is the now rapidly declining federal budget deficit. Even with improving levels of private investment and increasing consumption, the sheer size of the budget deficit will make it difficult for total corporate profits to increase over the next couple of years. Analysts have recently lowered their estimates for the FY2013 federal budget deficit from $900 billion to $775 billion, a decline of $225 billion from the year before . Street estimates for S&P 500 earnings are trending lower, but consensus forecasts still are for 10% annualized growth in profits for the next 2-years . As the deficit continues to decline the other sources of profits outlined above will have to more than offset that decline for earnings to meet expectations.

Many investors don’t fully appreciate this relationship between deficits and corporate profits. Understanding where profits come from and how the different sources interact is an essential tool for all investors. In order for US profits to remain essentially unchanged in 2013, we will need to see increases in contributions from the other elements in the equation. We view the currently high profits of U.S. corporations as unsustainable in the long-term. Ironically, we believe that the improvement of the economy and resulting decline in the budget deficit should be the catalyst for normalization in profits. While this normalization can be a headwind to earnings over the next couple years, it should prove healthy for markets over the long-term as the economy is put on a more sustainable path.

For more reading on this topic please refer to:
http://www.zerohedge.com/sites/defa.../02/Montier - What goes up must come down.pdf
http://www.levyforecast.com/assets/Profits.pdf
 
How do you know how much you get? For example, what if a severe economic downturn occurs which results in a 25% reduction in federal receipts?

Then you cut spending by 25%.
 
Back
Top Bottom