• This is a political forum that is non-biased/non-partisan and treats every person's position on topics equally. This debate forum is not aligned to any political party. In today's politics, many ideas are split between and even within all the political parties. Often we find ourselves agreeing on one platform but some topics break our mold. We are here to discuss them in a civil political debate. If this is your first visit to our political forums, be sure to check out the RULES. Registering for debate politics is necessary before posting. Register today to participate - it's free!

Rate of Increase in Deaths in the US Flat or falling through Covid Crisis.

code1211

Banned
DP Veteran
Joined
Jul 13, 2012
Messages
47,695
Reaction score
10,467
Gender
Male
Political Leaning
Other
The rate of deaths in the US rises every year since 2009 peaking at a growth rate of 1.29% in 2014.

Beginning in 2015, that rate of growth in deaths from all causes has been flat or falling. This includes the "crisis" year of 2020.

Also interesting is that the rate of deaths per 1000 increased in 2020 over 2019 LESS than the increase of 2019 over 2018.

In passing, during every year of the Trump administration, the rise in the rate of deaths from all causes in the US was less than the years immediately preceding the Trump Administration years.

Something fishy is going on here. Is the real world wrong or is the reporting of the real world by the media propagandists wrong?


United States - Historical Death Rate Data
YearDeath RateGrowth Rate
20218.9771.090%
20208.8801.120%
20198.7821.120%
20188.6851.220%
20178.5801.240%
20168.4751.270%
20158.3691.270%
 
Last edited:
"NOTE: All 2020 and later data are UN projections and DO NOT include any impacts of the COVID-19 virus."

It's not like it was in HUGE letters at the top of the page you linked, or anything like that.
 
More boomers dying.

Boomers are that huge bulge in the population curve. They were born after the end of WWII.
 
US COVID deaths: 543,000.

And as was already pointed out, OP is bullshit anyway.
 
The rate of deaths in the US rises every year since 2009 peaking at a growth rate of 1.29% in 2014.

Beginning in 2015, that rate of growth in deaths from all causes has been flat or falling. This includes the "crisis" year of 2020.

Also interesting is that the rate of deaths per 1000 increased in 2020 over 2019 LESS than the increase of 2019 over 2018.

In passing, during every year of the Trump administration, the rise in the rate of deaths from all causes in the US was less than the years immediately preceding the Trump Administration years.

Something fishy is going on here. Is the real world wrong or is the reporting of the real world by the media propagandists wrong?


United States - Historical Death Rate Data
YearDeath RateGrowth Rate
20218.9771.090%
20208.8801.120%
20198.7821.120%
20188.6851.220%
20178.5801.240%
20168.4751.270%
20158.3691.270%

Nope, none of the above. As Timrin mentioned, you just missed the obvious:

Screen Shot 2021-03-23 at 11.16.33 AM.png

Perhaps in your haste to point to some kind of media issue, you can sympathize with them a bit when they get something wrong just as you did here.
 
Nope, none of the above. As Timrin mentioned, you just missed the obvious:

View attachment 67324421

Perhaps in your haste to point to some kind of media issue, you can sympathize with them a bit when they get something wrong just as you did here.

Do you have better statistics to site?
 
Do you have better statistics to site?


You could always check the CDC...

The U.S. death rate increased by 15 percent last year as a result of the Covid-19 pandemic, making it the deadliest year in recorded U.S. history, the Centers of Disease Control and Prevention will announce, according to two senior administration officials with direct knowledge of the matter.
The agency will summarize its findings in an upcoming issue of Morbidity and Mortality Weekly Report. Its analysis will detail the rates at which U.S. residents of various races and ethnicities died as a result of the virus as well as the total number of deaths in each demographic group, those sources said.
Covid-19 was the third leading cause of death behind heart disease and cancer, the report found. “Unintentional injuries” is normally the third-leading cause of death, officials said.


Altogether more than 3 million people in the U.S. died in 2020, the agency found.


More boomers dying.

Boomers are that huge bulge in the population curve. They were born after the end of WWII.
Talk about transfer of wealth.
 
Do you have better statistics to site?

@Airyaman beat me to it, so see post #9. Our World In Data has been really good with overall stats on the pandemic. Also, the problem isn't with the stats, but that you thought they represented something they don't despite the disclaimer at the top of the stats.
 
Last edited:
Do you have better statistics to site?

As of mid January 2021 there were 550,000 more U.S. Deaths Than Normal Since Covid-19 Struck.

That’s is a 21 percent increase than death stats from each of the 5 years previously ( 2015, 2016, 2017 , 2018 or 2019.

 
You could always check the CDC...

The U.S. death rate increased by 15 percent last year as a result of the Covid-19 pandemic, making it the deadliest year in recorded U.S. history, the Centers of Disease Control and Prevention will announce, according to two senior administration officials with direct knowledge of the matter.
The agency will summarize its findings in an upcoming issue of Morbidity and Mortality Weekly Report. Its analysis will detail the rates at which U.S. residents of various races and ethnicities died as a result of the virus as well as the total number of deaths in each demographic group, those sources said.
Covid-19 was the third leading cause of death behind heart disease and cancer, the report found. “Unintentional injuries” is normally the third-leading cause of death, officials said.


Altogether more than 3 million people in the U.S. died in 2020, the agency found.


How does that number fit in a historical progression of deaths in the US?

I was impressed to see that the number of Flu deaths in 2020 fell off to almost nothing.

It seems like the top two risk groups were the elderly and the morbidly obese. BOTH groups are routinely beset with other conditions that kill them in higher numbers.

At some point, it seems that the overall number will be published in some meaningful way. It hadn't occurred to me that there is some normal amount of growth in deaths per year.

About 93% of the Covid deaths occur in the age group 60 and up. From ALL causes, that percent is about identical to the normal share of deaths accounted for in that age group from all causes. It just seems odd.

Anyway, taking the CDC estimate that there will be 3 million Americans dead in 2020, that would seem to include Covid Deaths. Yes?

At the 8.88 per 1000 death rate, If there are 340 million people in America for the death rate to be based upon, that is just about in line with the standard growth over the last several years.

If there are an extra 500+ thousand to include, where did they go? An ADDITIONAL 500,000 should increase the death count by 16%. The deaths per 1000 should be over 10.
 
Last edited:

View attachment 67324587

That is helpful.

I noticed something that I didn't anticipate, but probably should have.

The total mortality from all causes seems to grow every year vs the previous year and, of course, EACH of all of the previous years.

Comparing the current to an average based on numbers that always grow year over year would seem to overstate growth for the latest year.

Does that make sense?

So if we add up the digits to the number 10 and divide by 9, we get a base number of 5. 1+2+3 and so on to 9 gives us a total of 45. 45/9 = 5.

The difference between the next number, 10, and the average, 5, is large, but is exactly in line with the normal and usual growth.
 
@Airyaman beat me to it, so see post #9. Our World In Data has been really good with overall stats on the pandemic. Also, the problem isn't with the stats, but that you thought they represented something they don't despite the disclaimer at the top of the stats.

I am searching for a meaningful count to show us what ACTUALLY happened.

We are told that more than 500,000 died due to Covid.

There are reports that many who were said to have died OF Covid simply died WITH Covid.

IF 500,000 people died of Covid who would not have died without it, THEN the growth of deaths in the US should be about 10.5 per 1000 in 2020. A rise of about 1.62 per 1000.

Anything that doesn't work out to that growth indicates that the reported Covid deaths are either overstated or understated.

In passing, we also know that suicides and overdoses were also higher in 2020 than in previous years. Related, probably, to the shut downs and isolations, but not related to Covid infections.
 
As of mid January 2021 there were 550,000 more U.S. Deaths Than Normal Since Covid-19 Struck.

That’s is a 21 percent increase than death stats from each of the 5 years previously ( 2015, 2016, 2017 , 2018 or 2019.


NYT is paywalled for me.

What is their source for their data?

Also, is it a growth from EACH of the years or a growth from the average of ALL of the years?
 
Last edited:
I am searching for a meaningful count to show us what ACTUALLY happened.

We are told that more than 500,000 died due to Covid.

There are reports that many who were said to have died OF Covid simply died WITH Covid.

IF 500,000 people died of Covid who would not have died without it, THEN the growth of deaths in the US should be about 10.5 per 1000 in 2020. A rise of about 1.62 per 1000.

Anything that doesn't work out to that growth indicates that the reported Covid deaths are either overstated or understated.

In passing, we also know that suicides and overdoses were also higher in 2020 than in previous years. Related, probably, to the shut downs and isolations, but not related to Covid infections.

Thus far the numbers are about as accurate as can be expected; what the margin of error actually is will be hard to determine if at the core of your skepticism is how deaths were counted. As for suicides and overdoses, those are not attributed to the fatalities the CDC is tracking as it relates to the disease.
 
I am searching for a meaningful count to show us what ACTUALLY happened.

We are told that more than 500,000 died due to Covid.

There are reports that many who were said to have died OF Covid simply died WITH Covid.

IF 500,000 people died of Covid who would not have died without it, THEN the growth of deaths in the US should be about 10.5 per 1000 in 2020. A rise of about 1.62 per 1000.

Anything that doesn't work out to that growth indicates that the reported Covid deaths are either overstated or understated.

In passing, we also know that suicides and overdoses were also higher in 2020 than in previous years. Related, probably, to the shut downs and isolations, but not related to Covid infections.
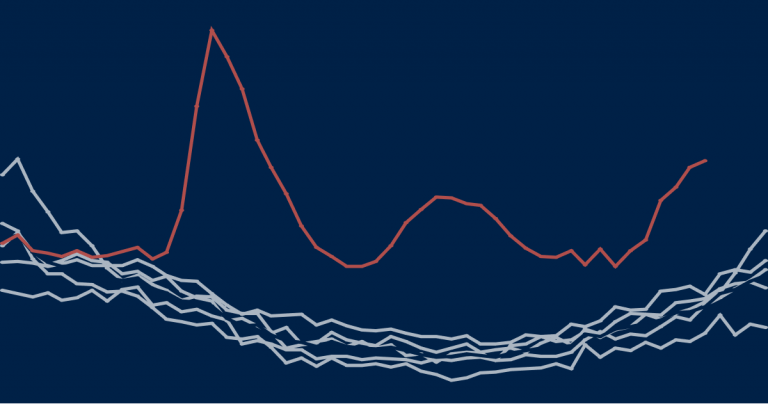
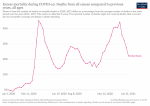
Did you happen to note that the excess mortality rates spiked around the same time periods that COVID-19 related deaths spiked?
 
Do you have better statistics to site?

Excess deaths are the better statistics.

Compare the greater number of deaths in 2020 than those of previous years.

Using excess mortality data is a more rigorous way to compare the pandemic’s death toll. Excess mortality counts deaths from all causes relative to what would normally have been expected. This avoids miscounting deaths due to the under-reporting of COVID-19-related deaths and other health conditions left untreated, or potentially misattributing deaths to COVID-19 that had other causes. Measures taken by governments and individuals may influence death rates – for example, deaths from traffic accidents may decline but suicide rates may rise. Excess mortality captures the net outcome of all these factors. We show that the P-score – a measure of the rate of excess deaths (actual deaths minus ‘normal’ deaths) relative to normal deaths – is preferable to measuring excess deaths relative to population.

 
You could always check the CDC...

The U.S. death rate increased by 15 percent last year as a result of the Covid-19 pandemic, making it the deadliest year in recorded U.S. history, the Centers of Disease Control and Prevention will announce, according to two senior administration officials with direct knowledge of the matter.
The agency will summarize its findings in an upcoming issue of Morbidity and Mortality Weekly Report. Its analysis will detail the rates at which U.S. residents of various races and ethnicities died as a result of the virus as well as the total number of deaths in each demographic group, those sources said.
Covid-19 was the third leading cause of death behind heart disease and cancer, the report found. “Unintentional injuries” is normally the third-leading cause of death, officials said.


Altogether more than 3 million people in the U.S. died in 2020, the agency found.


Okay. So the UN said that the projected death rate for 2020 would be 8.8 per thousand assuming no extra deaths due to Covid. This is, obviously, .88% of the population.

3 million, probably an estimate since almost no exact count of anything ends with 6 zeroes, is 0.9% of the 330+ Million US CITIZEN Population. I have heard that the RESIDENT population is closer to 350 million.

I don't know if immigration status tests are performed on folks who died of Covid. Do you have any source for this? I couldn't find one.

0.90% is a bit higher than the 0.88% projected by the UN. Figured on 330 million, it comes out to around a 66,000 increase year over year. Round numbers across the board.

On 350 million, 3 million is only 8.5% and is actually lower than the UN projection.

Whatever else we know, if use your 3 million fatality count number as a total deaths tally, we can see pretty easily that the 550,000 dead figure seems to be inflated.

If 550,000 IS accurate, then OTHER CAUSES of death seem to have dropped by about 20% in a Twilight Zone kind of a pause as Death Takes a Holiday. We know, though, that suicides and overdoses went up.

Again, there are oddities in the statistics that seem to to have been put there by design.

In passing, I find it interesting the Indiana counts Covid deaths incorporating updates over the last several months. The most recent IDH number for overall fatalities, though, seem to be from 2018.
 
The rate of deaths in the US rises every year since 2009 peaking at a growth rate of 1.29% in 2014.

Beginning in 2015, that rate of growth in deaths from all causes has been flat or falling. This includes the "crisis" year of 2020.

Also interesting is that the rate of deaths per 1000 increased in 2020 over 2019 LESS than the increase of 2019 over 2018.

In passing, during every year of the Trump administration, the rise in the rate of deaths from all causes in the US was less than the years immediately preceding the Trump Administration years.

Something fishy is going on here. Is the real world wrong or is the reporting of the real world by the media propagandists wrong?


YearDeath RateGrowth Rate
United States - Historical Death Rate Data
20218.9771.090%
20208.8801.120%
20198.7821.120%
20188.6851.220%
20178.5801.240%
20168.4751.270%
20158.3691.270%

Just some advice, everything is not a conspiracy.
 
Thus far the numbers are about as accurate as can be expected; what the margin of error actually is will be hard to determine if at the core of your skepticism is how deaths were counted. As for suicides and overdoses, those are not attributed to the fatalities the CDC is tracking as it relates to the disease.

We agree, as I said, that the cause of Suicides and Overdoses were not Covid.

The HUGE numbers attributed to Covid deaths in the US should show up as an i crease in the overall death total. If they don't, then something stinks.

As we've moved through this thread, a number of OTHER consideration rose from the statistics. Are only citizens counted and non-citizens omitted?

The count of folks within the borders is 330 million citizens or 350 million all told. Is a citizenship test performed along with the Covid test?

The UN projection of 8.8 dead per 1000 changes the total dramatically if it is based on 330 million or based on 350 million. 8.8/1000 on 20 million is 176,000 dead. By no means a small number of dead.
 
Did you happen to note that the excess mortality rates spiked around the same time periods that COVID-19 related deaths spiked?

I didn't notice much as the source linked is paywalled for me.

What was the source of the numbers presented?
 
We agree, as I said, that the cause of Suicides and Overdoses were not Covid.

The HUGE numbers attributed to Covid deaths in the US should show up as an i crease in the overall death total. If they don't, then something stinks.

As we've moved through this thread, a number of OTHER consideration rose from the statistics. Are only citizens counted and non-citizens omitted?

The count of folks within the borders is 330 million citizens or 350 million all told. Is a citizenship test performed along with the Covid test?


The UN projection of 8.8 dead per 1000 changes the total dramatically if it is based on 330 million or based on 350 million. 8.8/1000 on 20 million is 176,000 dead. By no means a small number of dead.

  • Q1: No, because there is no tracking of citizenship status when taking COVID 19 tests. We don't ask citizenship questions for medical procedures as a whole since it isn't relevant to medical treatment.
  • Q2: No, because of my answer to Q1.
 
Back
Top Bottom