• This is a political forum that is non-biased/non-partisan and treats every person's position on topics equally. This debate forum is not aligned to any political party. In today's politics, many ideas are split between and even within all the political parties. Often we find ourselves agreeing on one platform but some topics break our mold. We are here to discuss them in a civil political debate. If this is your first visit to our political forums, be sure to check out the RULES. Registering for debate politics is necessary before posting. Register today to participate - it's free!

DOW = 33,430

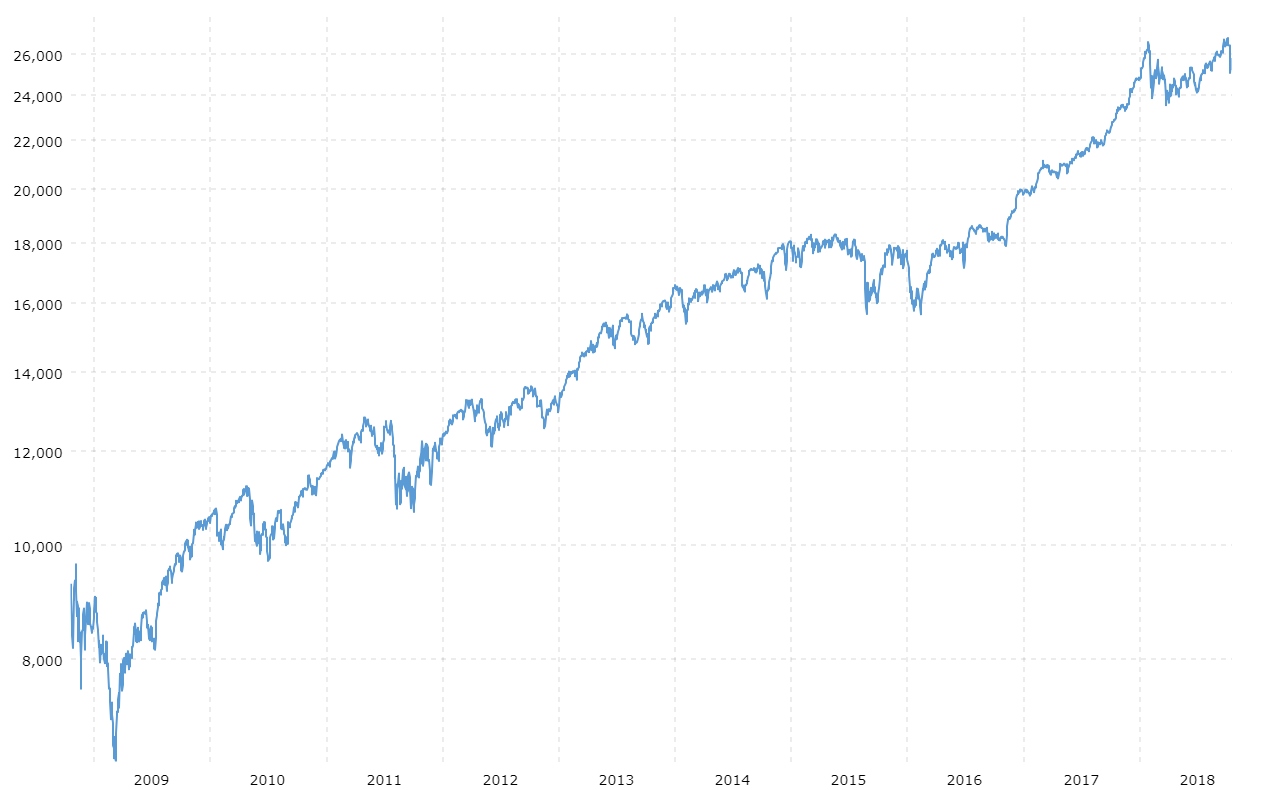
How about a chart from, oh say last March. Show that kind of market trend Biden inherited.
How about a chart from 2009 to see what kind of a market trend Trump inherited? Facts are the trajectory has been this way for 10 years. Another factoid, Trump created fewer jobs than Obama and did no better, maybe even a bit worse, on GDP comparing Obama's last 4 years to Trumps' first, and only, 4 years.

Trump did little to improve the economy, in fact his tariffs hurt it, but he surely did convince the fact-free base that he did. Bobble heads gotta bobble.
 
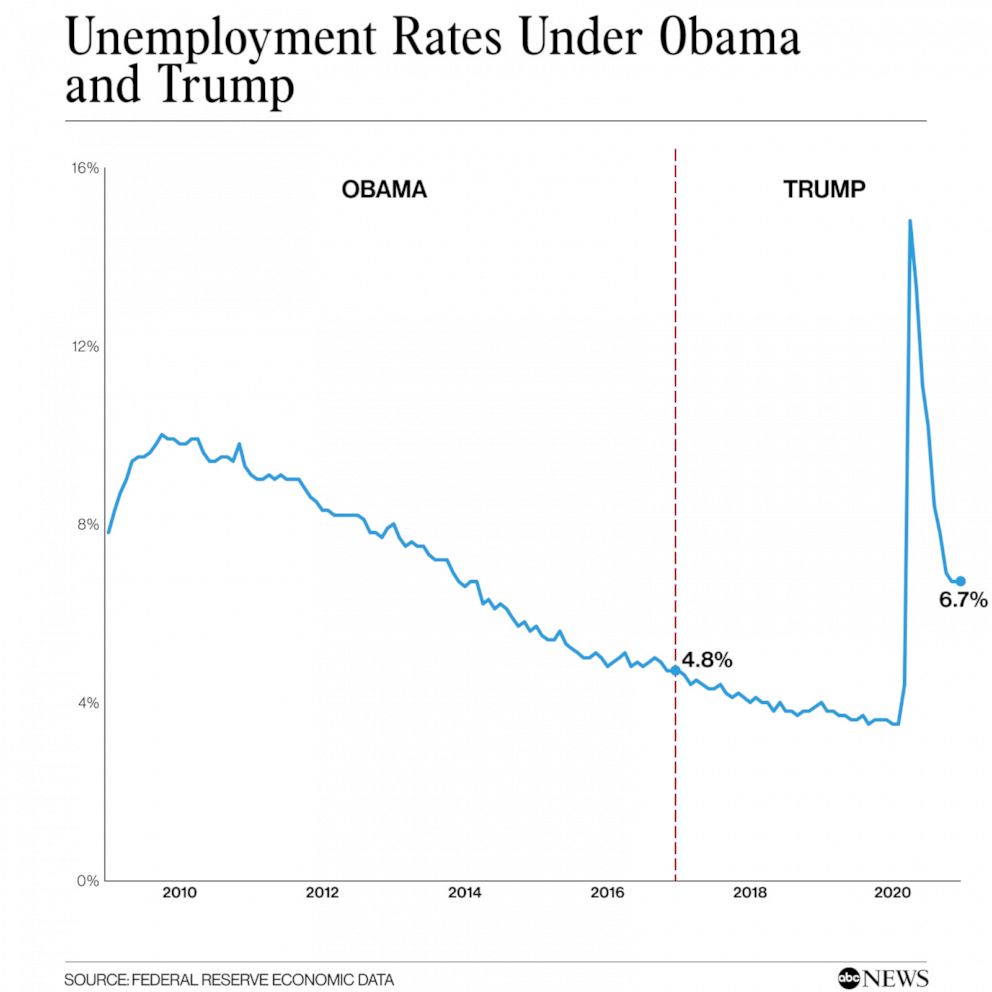
you mean like unemployment?...


A look at Trump's economic legacy - ABC News's economic legacy - ABC News
This type of disingenuous bullshit does not do you justice.
 
How about a chart from 2009 to see what kind of a market Trump inherited? Facts are the trajectory has been this way for at 10 years. Another factoid, Trump created fewer jobs than Obama and did not better, maybe even a bit worse on GDP comparing Obama's last 4 years to Trumps' first, and only, 4 years.

Trump did little to improve the economy, in fact his tariffs hurt it, but he surely did convince the fact-free base that he did. Bobble heads gotta bobble.

2009 is ancient history and his no bearing on the current situation. All your chart shows is a market running out of steam in 2016 until November when Trump won and a strong up market since then.
 
All at once? Sweet. My wife and I just do dollar-cost averaging. And a smart thing too doing the Roth contributions.
Yeah, I lagged for a few years. I've added some Roth to my current work 401(k), and made the 2020 contribution for my IRA and Roth from other jobs. That one does really well with dividends re-invested every quarter.

I need to punch the Roth up more, I can add $7000 for 2021.
 
No matter HOW MANY times you trot out this charts they’re still meaningless. Hard number: GDP growth in 2016 1.6%. And seriously: a chart comparing GDP to 2000? WTF does that show? Obama almost perfectly timed the recession ending wave and then FUBAR’ed it into the worst recovery since WW II. Less than a year after the COVID hit Trump had unemployment back to 6.0%; something it took Obama almost six years to accomplish - and HE HAD the recovery going on.
 
All your chart shows is a market running out of steam in 2016 until November when Trump won and a strong up market since then.
You either need glasses or shock treatment!
 
You either need glasses or shock treatment!
h
My glasses work just fine looking at detailed data rather than broad span charts. Which is why you lefties love multi-year, creatively scales non sequiturs. I like to focus on 2015-2016 because they represent the economy Trump was actually handed; All the goobledegook that handled six or seven years earlier when the economy was trying to rebound don’t affect today’s economy.
 
^^
Trumpist who gave Trump immediate and full credit for the booming economy Obama handed him.
Obamaists who’s imaginations outweight their grasp on reality. There was no “booming economy”. Some economists were talking about a recession on the horizon. Again, GDP grown of 1.6% ofr 2016 and slighly over 2.0% for his entire term hardly speaks “booming economy” except to Dear Leader’s drones and robots.
 
I wonder what will happen when interest rates come up, there are indications that we are in a bubble that is years in the making
 
OK but that still doesn't show what percentage of companies are overvalued.

And people who try to make that evaluation sometimes use the metrics they like.

Who the hell could accurately pinpoint that figure? Mine is a guess.
 
hasn't moved much. now at...

33,745
 
How about a chart from, oh say last March. Show that kind of market trend Biden inherited.

like this:
You mean just like the one Trump inherited from Obama / Biden?
you have to remember Obama took over when it was still going down because of Bush's recession and it went down into the low of 6,547.05 in the fall of 2009 and was 19732 the day Trump took over
Have a nice night
 
/sarcasm on
But, But, it has to be Trump's economy and policies that are causing the rise in the stock market
/sarcasm off

Stocks go up, Stocks go down. Trend is generally upward over time.
My take, we will see a crash in a few years with another recovery.
 
Wealthy people are getting wealthier- woo hoo.
 
You mean just like the one Trump inherited from Obama / Biden?
Nope, Trump inherited a weak, gasping economy, bordering on recession.
Tbird said:
you have to remember Obama took over when it was still going down because of Bush's recession and it went down into the low of 6,547.05 in the fall of 2009 and was 19732 the day Trump took over
Obama took over an economy poised to start recovering; He managed to turn in the worst recovery since WW II.
Tbird said:
Have a nice night
You too. Seems like you’ve already dreaming.
 
All due to Trump’s plans and programs - Biden inherited it all.

You mean, Trump inherited a growing economy from Obama, did little to improve it and in the end wrecked most of the economy besides the stock market?

Biden has done little to make the stock market grow either, the stock market is a twisted thing that is fueled mostly by greed and not reality.
 
Back
Top Bottom